
How to Time the Markets Using Technical Analysis
Through the years, market timing in stock market has been taken negatively by people. Most individuals have been convinced by the belief the key to success in stock investment is to invest in long run accounts so not to miss the good days. Yet, along with changes from the history up to now, the belief of people have been altered as well.
When you are thinking about buying something, you always hold control of the trigger, whether to buy it or not. In terms of buying a stock, the decision is all yours whether or not to purchase it. With this, market timing technique is an essential factor in earning your success in this endeavor. For those who don’t know how to do market timing then these tips below will help you in the process of understanding and know.
-
Understand the market trends
-
Dow Theory
Have some knowledge with the Dow Theory in marketing. This must have been the origin of technical analysis that existed many years ago. According to this theory, the stock market needs to be analyzed to determine the best time to invest in the market.
-
Moving Averages
Moving averages are seen useful in determining the trends in prices in the current market. The 200 day averages used to confirm the long term trend and 100 and 50 day averages used to confirm the medium and short term trend.
Using moving averages can help you smoother when the fluctuations in the market usually happen. A person will easily know the trends on the stock market once moving averages are used. Any change in the direction of the moving average can be an indication that other factors in the market are affected by the fluctuation.
-
Spot support and resistance zone
-
RSI – Be knowledgeable about the overbought and oversold scenario
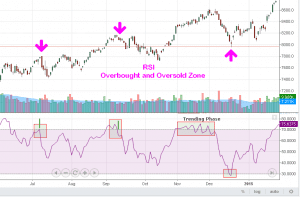
The need for spotting the resistance zone is necessary as the price in the stock market affects the actual resistance of the stocks. You need to remember that the current trend within the zone affects the performance of RSI. In the case of, RSI heading above 70 were generally treated as strong bullish momentum but failure to sustain 70 treated as overbought indication can be considered as resistance zone. The upside crossover from reading 30 is an indication the support zone.
-
Fibonacci Retracement
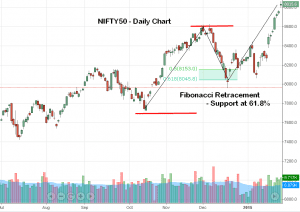 This is one way of forecasting market trend where the areas in the stock market that need retracement are determined. Support is when the price attracts buyers at lower levels while resistance is when it gets sellers at higher price levels. Fibonacci is as helpful tool in stock investment because it helps determine the probable support or resistance zone. The Golden mean 61.8% used as proportionate reaction with its previous trend to calculated the probable retracement zone. In this way, it helps trades to time their trade with appropriate entry levels along with stoploss and targets.
-
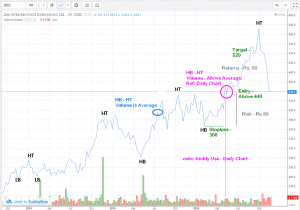
Identify trend reversal (Candlestick pattern)
The trend reversal is the frequent change of the price trend in the stock market. It often used by short term traders or swing traders. The candlestick pattern such as engulfing, piercing, doji, hammer, shooting star, etc need to be closely monitored because it represents the trend reversal. It may be used to determine the trade plan.
If you want your stock trading business to be at its best state, you have to be well knowledgeable in terms of these matters for you to have the most of your investment in the stock market.
Post your comments in the below section