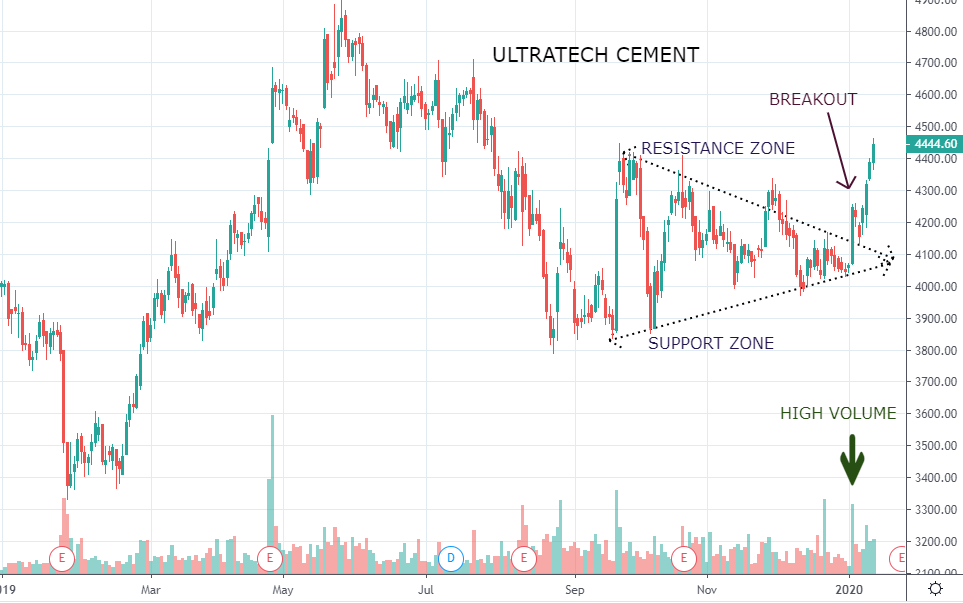
On the daily chart, the stock has witnessed a smart upside breakout from the triangle pattern witnessing a good increase in volume and strong bullish candle.
The overall trend is primarily bullish but the stock has been sideways movement since 2017. The recent breakout might to take the stock on new all-time high.
In addition, price have closed above the higher range of the Bollinger band, indicating a trending up-move after in recent consolidation. Apart from this, it is trading above all key moving averages of 21, 50 & 200-day SMAs.
The support on the lower side is pegged at 3800 level while on the upside hurdle is seen at 4900 level.
For the past few weeks, peer stocks are seeing impressive moves and the above technical setup suggests the stock is gearing up for a strong move in the near term.

