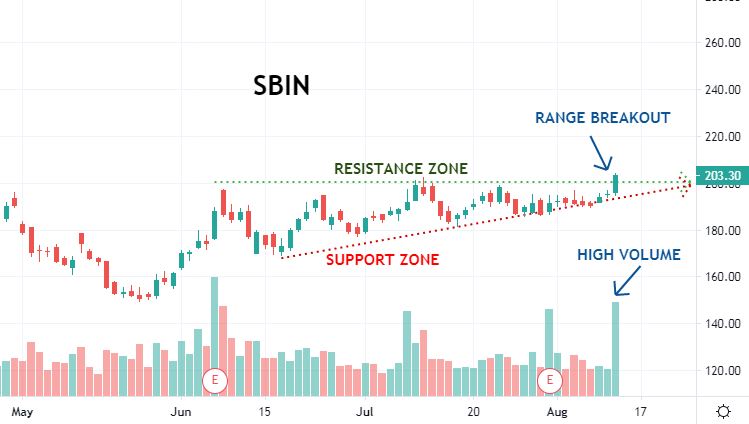
- After a few months long consolidation SBIN witnessed a triangle pattern breakout, backed by increase in trading volumes.
- The stock has witnessed a sharp selloff from 300-320 levels and has bottomed out around 170-200 levels.
- In addition, the stock have closed above the higher range of Bollinger band.
- The support on the lower side is pegged at 170 levels with no immediate upside resistance.
- Any sustainable move above the neckline 210 level could have the strong positive impact in the near term.
SBIN Looks Like It’s Finally Found a Floor
Author: Valarmurugan
Published Date: August 13, 2020

Do you wish to invest in stock market?
Stay Informed with EQSIS Tools and Services
Stock Market Training
3 days classroom training + 30 days online practice. Here you can learn from basics to advance concept.
Intraday Scanner
We have best in-class intraday scanner which helps you in stock selection.
Follow Us
You can joins us using your prefered social network
