
Profitable Bollinger bands trading strategy.
INTRODUCTION
Bollinger Band is a range bound indicator. Bollinger band was introduced by Mr. John Bollinger at 1980. It is one of the most widely used indicators known for its satirical approach.
DEVELOPMENT OF BOLLINGER BAND
Bollinger band derived its structure from two basic mathematical concepts one is moving average other is the standard deviation. To make the concept clear let us start to build it from average calculation. The closing price is taken for calculating the moving average and also for standard deviation.
Average
Average= sum of the value /number of values.
Taking it into stock market terms we can say,
Average= sum of the price/time interval.
In Bollinger band time interval 5 to 25 is used. It means 5 candles to 25 candles in time frames. Generally, it is preferred to take 20 candle time interval in Bollinger band.
For eg., if the prices for 5 days is 1, 2, 3, 4, 5.
The average will be (1+2+3+4+5)/5 (Num. of terms) =15/5=3
In the next day if the stock moves one more point then what will be the MA? We already have noted time frame as 5 so the value of last five candles are considered including the newer value,
2+3+4+5+6/5(time frame) = 4
The next day if the price moving one more point then it will be,
3+4+5+6+7/5 =5
Since the average is moving from point to point depending on the price movement it is called as a moving average.
Standard deviation
Standard deviation is nothing but a measure of variation from a mean (Average). From stock market perspective; if the standard deviation is low then the price movement is nearer to the average. If the standard deviation is high, then this indicates the longer trading range.
Finding the standard deviation and the moving average gives Bollinger band.
Bollinger bands formula:
Middle band = 20-day simple moving average
Upper band = 20-daySMA+ (20-days standard deviation of prices x 2)
Lower band = 20-days SMA-(20- days standard deviation of prices x2)
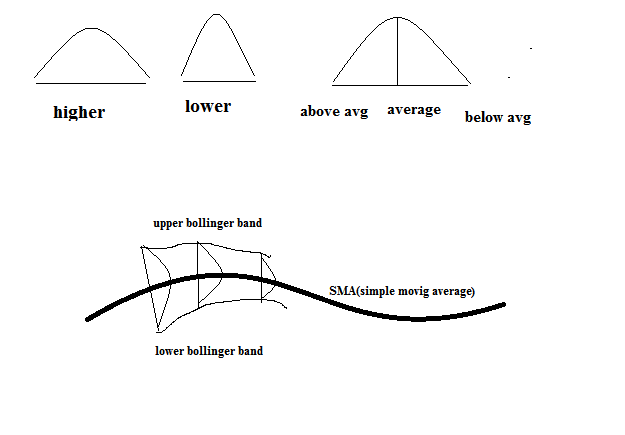
PRICE MOVEMENT AND BOLLINGER BEHAVIOR
Bollinger band is a volatility based indicator. It helps to identify whether the stock is trading above average, below average or out of range bound. Bollinger band have a number of movements. Each change in the price movement can indicate the change in the structure of Bollinger band.
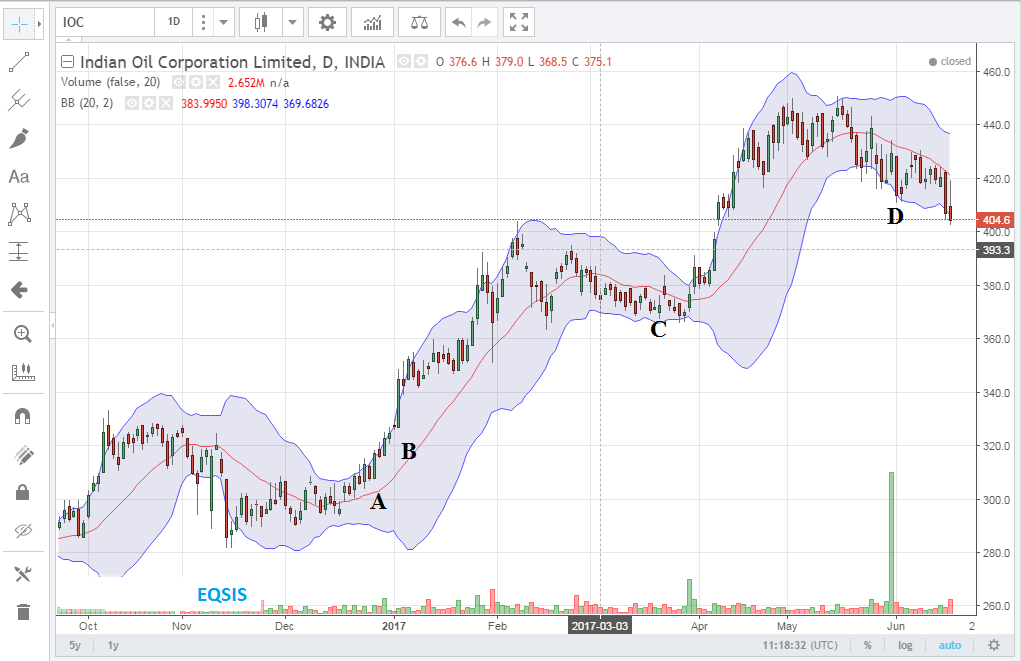
A= (increase in volatility) both upper and lower band is moving away.
B = (indicating a steady run) bands are moving in the same direction and the price is moving very close to the band (indicating a steady strong trend).
C = (indicating falling volatility) bands are converging nearer.
D = (indicating the change of trend) the price had crossed the moving average and the price within the average and a band (showing strength in the trend).
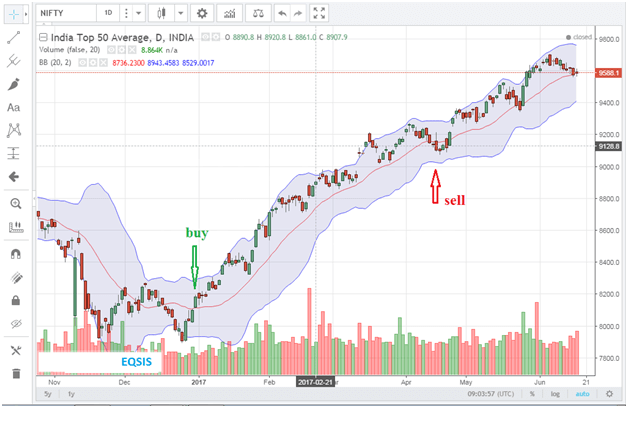
The price is moving above the SMA (Simple Moving Average) within the upper Bollinger band showing there is a steady bullish interest in the market. If the price is moving between the SMA and the lower Bollinger band then it indicates the bear trend. During such conditions following buy sell signals of moving average may be profitable.
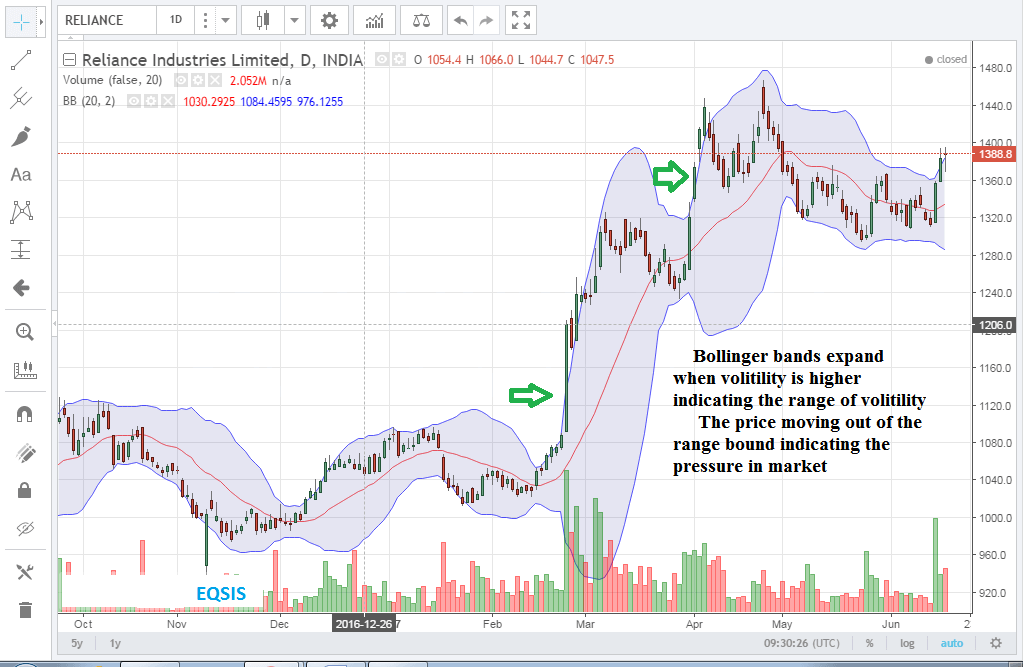
 Bollinger band breakout
If the price breaks the Bollinger band then the price movement reveals that the trend is proceeding with great strength. In such conditions, the Bollinger band expands due to volatility. Usually market moves in consolidation. Breakout happens occasionally with intense volume in it so it happens with noise and volatility.
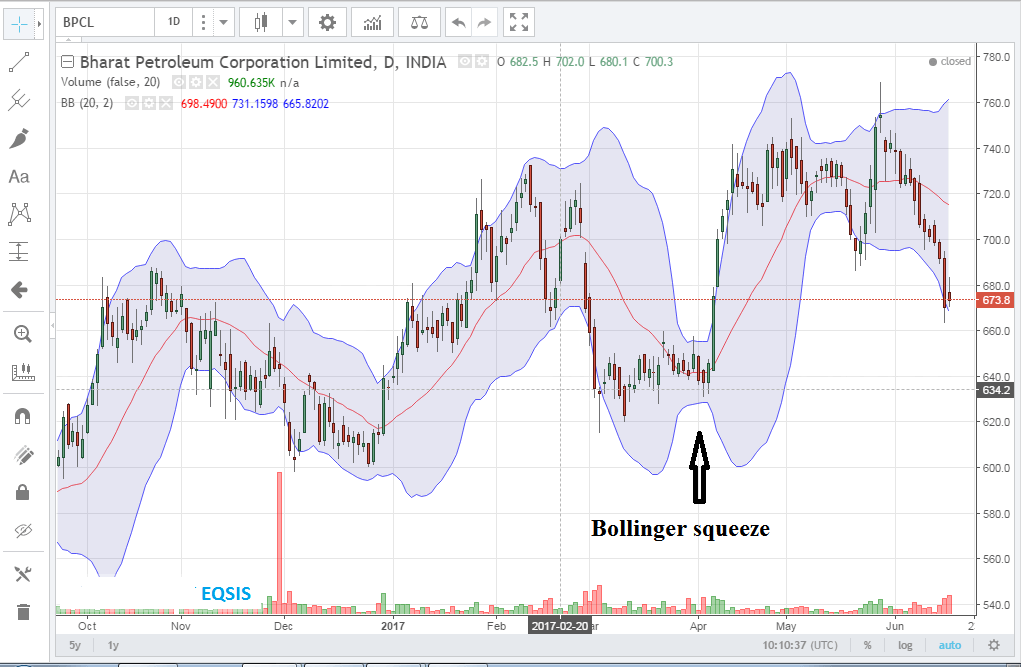
Bollinger band squeeze
It is said as Bollinger squeeze when the price is moving inside a closer range bound and both the upper and lower Bollinger band will be trailing very near to the SMA. Always Bollinger band squeeze is followed by a breakout movement or can be said as volatility will be increased. Traders usually exit trades when the Bollinger squeezes it is why because the trend can change after a squeeze.
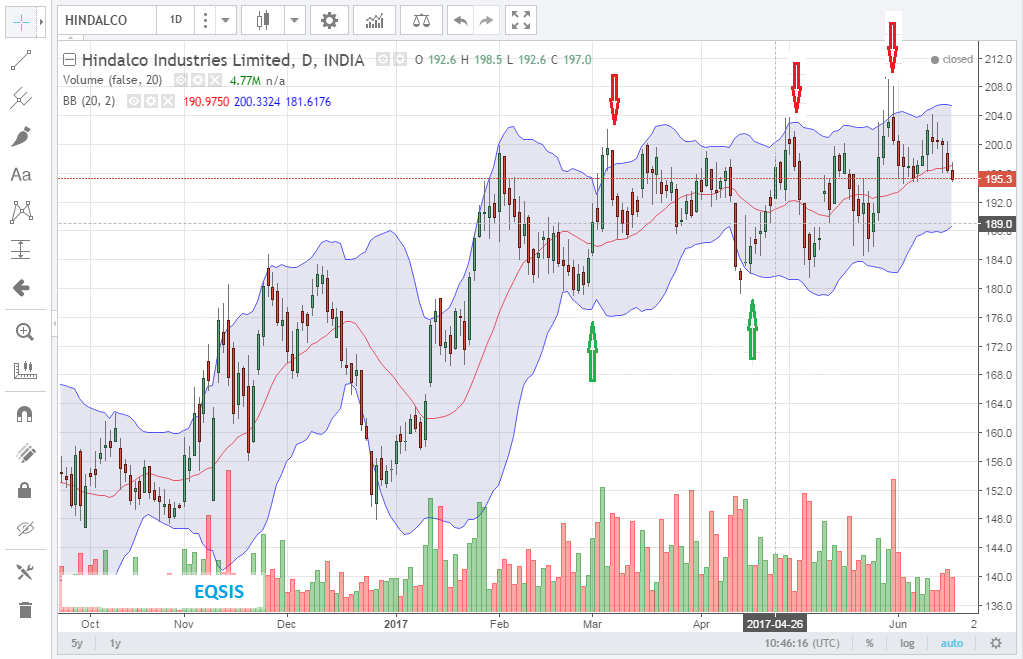
Bollinger bounce back
Bollinger bounce is a condition observed mostly when the price moves in a consolidation within a range bound. Traders usually will create a short position near to the upper Bollinger and a long position when the price is bouncing near the lower Bollinger band. This is one of the profitable strategies in a consolidating market since most of the time prices move within its range.
Conclusion
Bollinger band is one such indicator which indicates the zone where the price is prevailing. It is one of the most widely used indicators.
FAQ
-
Is Bollinger band used for positional or day trading?
Indicators need historical data and the data should be consistent. Intraday charts are not that consistent when compared to positional charts. Although traders are using Bollinger band for intraday. The author Mr. John Bollinger has recommended using 20 days time interval.
-
What is the concept behind Bollinger band?
It uses average calculation for SMA and uses standard deviation for the calculation of lower and the upper bands.
-
Where to buy and where to sell using Bollinger band?
There are various ways to trade using Bollinger band. During the narrow band, the lower Bollinger band is used as support and the upper Bollinger band is used as a support. If the band gets wider then the moving average is taken as a support and resistance.
-
Will Bollinger band work during sideways or trending market?
Bollinger band is one such indicator which is used to differentiate the sideways from trending. The trading style using Bollinger band itself differs based on the behavior of the band.
-
What parameter should be used for short-term traders?
Bollinger band works well for swing trading. As per author John Bollinger band works will in 20 days time interval.
Comment your views below. Feel free to contribute your points.