Infosys hovering near all-time high; chart suggest more upside

Infosys hovering near all-time high; chart suggest more upside

  • This stock has been hovering around 800 level for the past few days with an appearance of flag pattern.
  • The stock was in a major consolidation mode within the range 700-770 level for the past 6 months but broke out of the consolidation range level with the appearance of high-volume breakout on 15th July, immediately after the outcome of quarterly earnings.

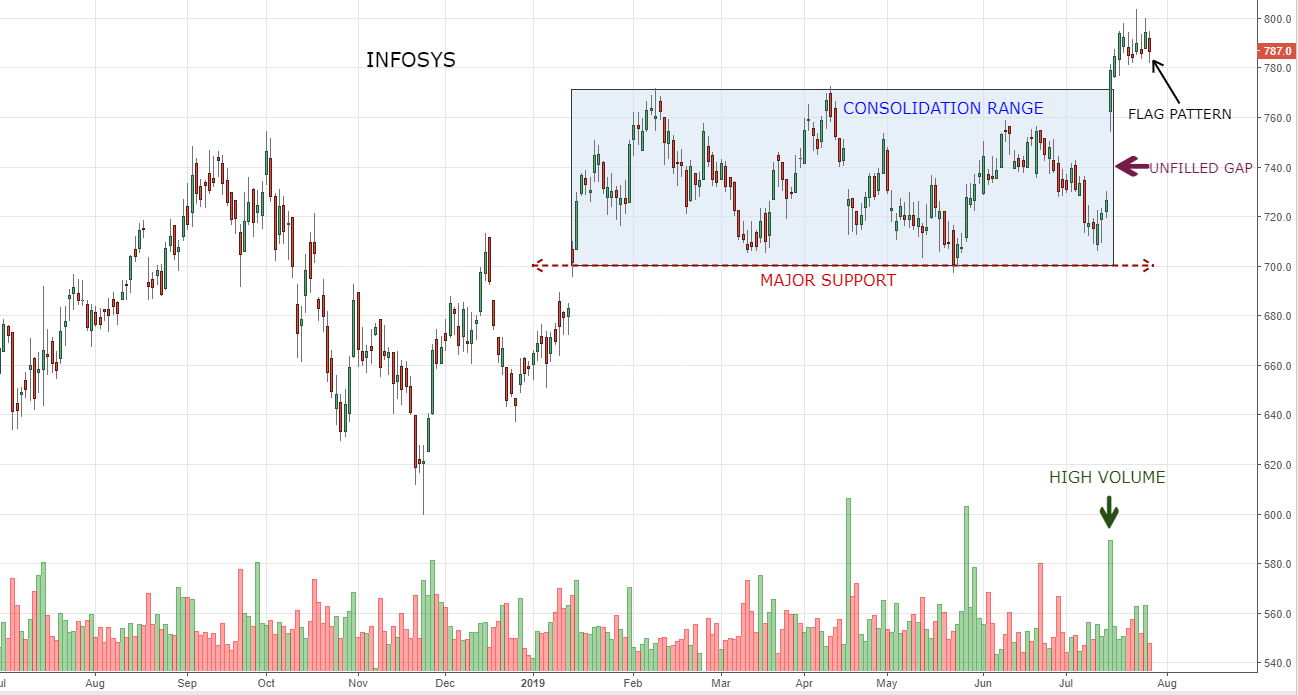
  • The major support for the stock is placed at 700 level. On the indicator front, the stock is well placed below its 21-days moving average line.
  • A break above the 804 level would provide confirmation for big upside rally.

Article Info

Published Date: July 29, 2019
Author: Valarmurugan

Related Terms

Stock Market Training

2 days classroom training+ 30 days online practice. Here you can learn from basics to advance concept.

Do you like Videos?

We got many concepts been explained in video format. You may like it!

An investment in knowledge pays the best interest.

— Benjamin Franklin

Feel Free to Ask Us

We wish to work more closely with our community. If you want us to share our insight on trading and investing, feel free to as us.

Do you wish to invest in stock market?

Stay Informed with EQSIS Tools and Services

Stock Market Training

3 days classroom training + 30 days online practice. Here you can learn from basics to advance concept.

Intraday Scanner

We have best in-class intraday scanner which helps you in stock selection.

Follow Us

You can joins us using your prefered social network