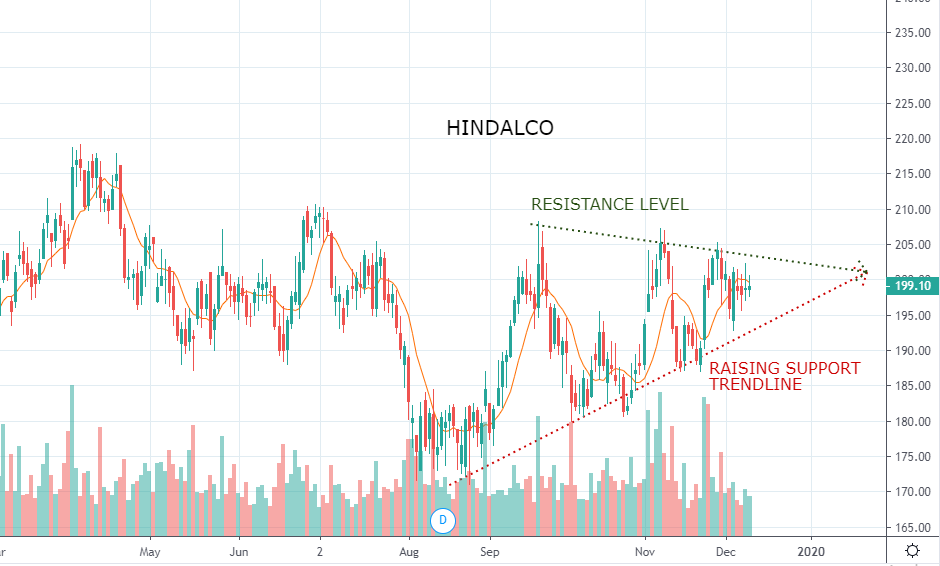
- Hindalco has clearly formed a triangle pattern and is now on the verge of a breakout on either direction.
- The stock has been trading in a downtrend for the last several years and there’s still no change in trend. Besides, the stock has found a strong support at 170 level with a series of higher bottom formation on the daily chart.
- The stock is also trading above the 21-day and 50-day SMAs.
- The support on the lower side is pegged at 170 level. On the other side, the zone of 205 to 210 is likely to act as an immediate hurdle for the stock.
- The stock has been hovering in a range for the last few weeks, Neither the bears or the bulls have adequate control and price will need to break the support or resistance barriers before a larger price movement could take place.
Hindalco heading towards breakout on either side
Author: Valarmurugan
Published Date: December 11, 2019

Do you wish to invest in stock market?
Stay Informed with EQSIS Tools and Services
Stock Market Training
3 days classroom training + 30 days online practice. Here you can learn from basics to advance concept.
Intraday Scanner
We have best in-class intraday scanner which helps you in stock selection.
Follow Us
You can joins us using your prefered social network
