
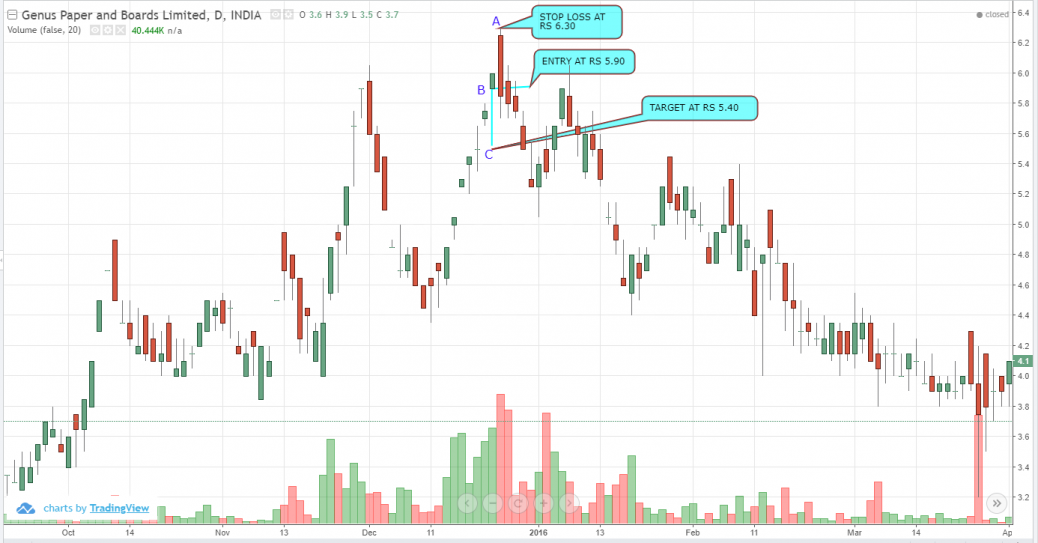
This is a reversal trend pattern. Here the piercing day is on 24-12-15. The corresponding volume is high. The body of the red candle covered the high of the previous day. Also it has covered more than 100% of the green candle. The entry price is at Rs 5.90. This is the lowest price of the green candle on 23-12-15. The stop loss is the highest of the red candle on 24-12-15 at Rs 6.30. The risk is between A to B which in money terms is Rs 0.40. So the target is entry at Rs 5.90 minus the risk of Rs 0.40 which equals to Rs 5.40.


Hi Radhakrishna,
The green candle has fully covered the red candle so I think it can be considered as engulfing. But I doubt whether it is piercing.
Thank you.
Hi,
Technical analysis can be more difficult to apply to low volume stocks so better you should avoid illiquid stocks.
Thank you for your valuable suggestion. Wish to know your comments on the trade plan.