
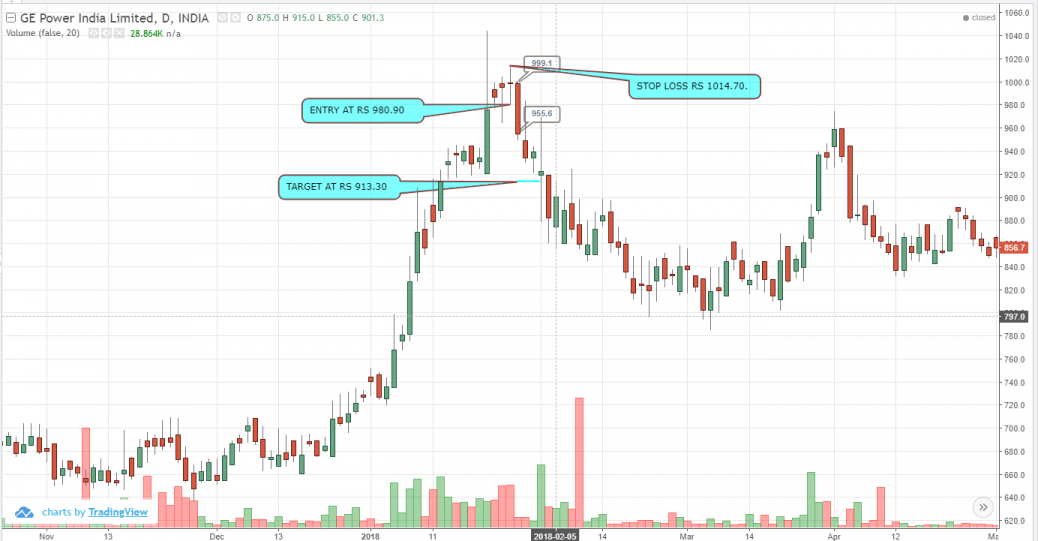
This is a reversal pattern from bullish trend to bearish trend. The Evening Star day is on 25-1-18. The volume was high. This proves that there was a lot of fight between the bulls and bears. But nobody got a upper hand and hence the star pattern which indicates that the price was neutral. The next day, that is on 29-1-18 the red candle managed to cover the low of the Doji day. It opened at Rs 999.10 and closed at Rs 955.60. My trade plan would be as follows:-
1) I will take a short position.
2) The entry point which is the lowest point on Doji day would be Rs 980.90. The entry date is 30-1-18.
3) Stop Loss would be Rs 1014.70 which is the highest point on Doji day.
4) I have arrived at the Target as follows:-
Risk = Rs 1014.70 minus Rs 980.90 = Rs 33.80. Two times risk is Rs 67.60. So entry point Rs 980.90 minus two times risk Rs 67.60 = Rs 913.30 which would be my target.


GOOD SPOT!
Thank you.