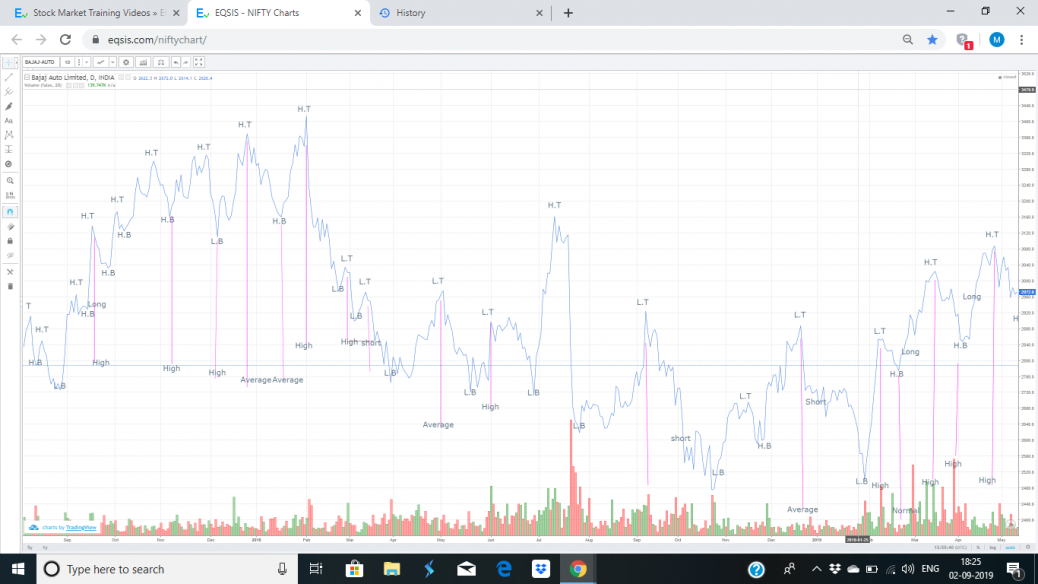
Line chart is used for highlighting the Trend based on Dow Theory. Higher Bottom ; Higher Top; Lower Bottom; Lower Top are marked in the chart. High Volume and Average Volume are marked. Top is the Supply Zone and Bottom is the selling Zone. Comparison of Higher Bottom to Higher Top with Good volume Will show a â Bullish Trendâ. We can create Long Position.Lower Top Lower Bottom with Volume will show â Bearish Trendâ. We can Create SHORT position. Major Tops and Bottoms are taken for consideration from the chart. Higher TOP to Higher Bottom is not a sequence and will not create a Bearish Trend. Higher Bottom to Lower top is not also a sequence. The trend is reliable for 1-3 months.Â
Dow Theory- Two year trend
feel free to call us   +919500077790     info@eqsis.com
0 Comments
Stock Analysis
M | T | W | T | F | S | S |
---|---|---|---|---|---|---|
1 | 2 | 3 | 4 | 5 | 6 | 7 |
8 | 9 | 10 | 11 | 12 | 13 | 14 |
15 | 16 | 17 | 18 | 19 | 20 | 21 |
22 | 23 | 24 | 25 | 26 | 27 | 28 |
29 | 30 |
Bullish View
Bearish View
- Bearish-GAP-SHORT-BICON-25-10-2019 October 25, 2019
- FEDERAL BANK – BEARISH ENGULFING October 17, 2019
- Cummins India – Bearish Engulfing – 24Sep19 September 25, 2019
- Day29-Tata Motors DVR – Bearish Piercing – 12Sep19 September 12, 2019
- Day27-Bearish-Engulfing pattern-Tech Mahindtra-09Sep19 September 10, 2019
How this forum help stock traders?
Stock Trading is business, the success depends not just on capital or subscribing advisory services or participating workshops. The factors such as your awareness level about business, Efforts and your contributions, Smartness, Knowledge in analysis and trading instrument, availability of infrastructure and emotional control determine your success.