
@stock
-
Mohan P. posted an update 3 years, 8 months ago
How the historical data like dow theory, Head and shoulder, Double top , Double bottom, price pattern and gaps will help for the present or current time to take a decision to buy or sell , entry, stop loss and fix target. How to synchronize the historical data for taking current decisions. Please explain.
-
Mohan P. wrote a new post, CUP-2-Axis 4 years, 7 months ago
It will take long time to construct. During the rounding bottom , the volume is expected to be very low.It is an Accumulation pattern . Trade Plan:Entry: 566.9Stop Loss: 486.2Target: 647.6Risk & Reward: 80.7
-
Mohan P. wrote a new post, Cup-Accumulation-Axis Bank 4 years, 7 months ago
It will take long time to construct. During the rounding bottom , the volume is expected to be very low.It is an Accumulation pattern . Trade Plan:Entry: 541.6Stop Loss: 503.5Target: 579.3Risk & Reward: 37.7
-
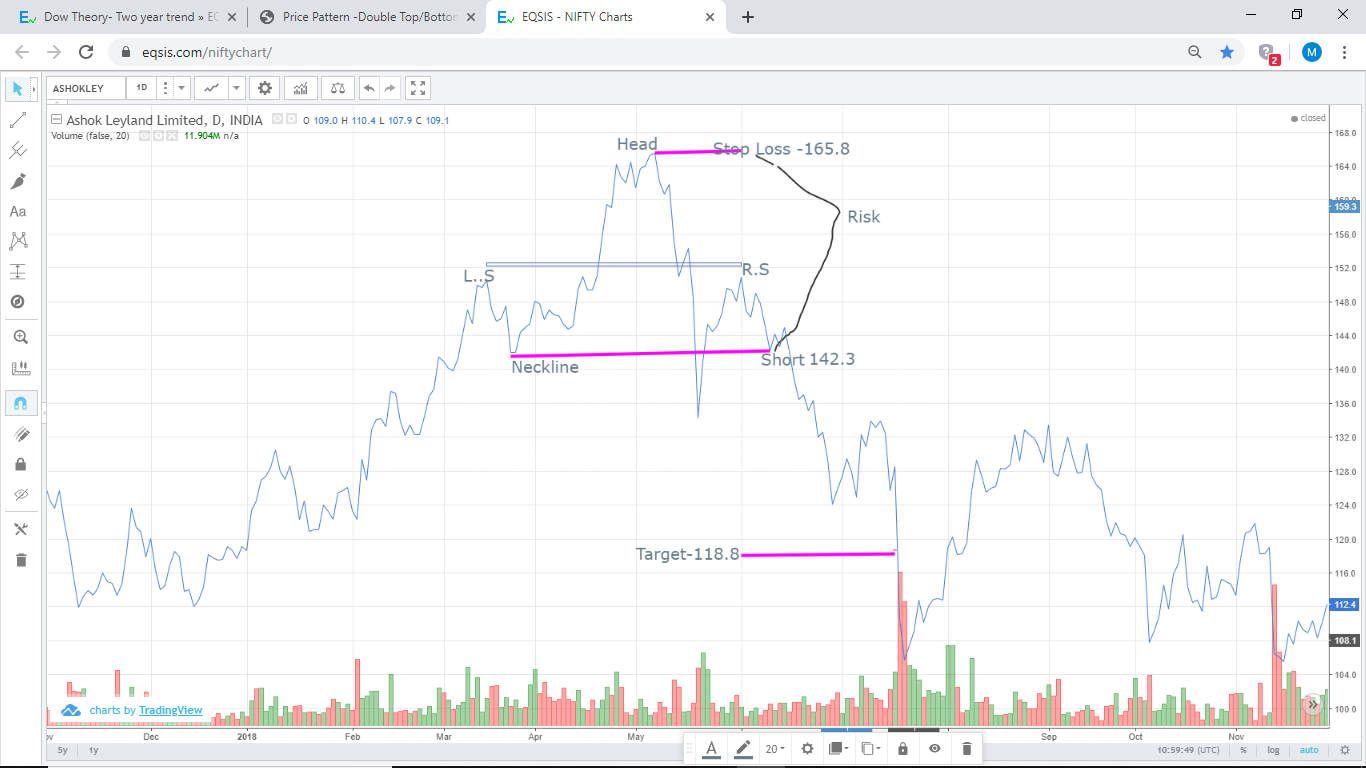
Mohan P. wrote a new post, Head and Shoulder-Ashok Leyland 4 years, 7 months ago
In between Left and Right shoulder , Head formation would be there. It takes minimum of 3 months to form. Volume is in Left Shoulder and less in the Right Shoulder area. Short Position is created in Neckline.
-
Mohan P. wrote a new post, Double Bottom-Long 4 years, 7 months ago
Two equivalent Bottoms not equal Bottoms.. The Duration between the two Bottoms should be one month.to identify the significance of Buying even after one month. Volume should be high in the second Bottom level or
-
Mohan P. wrote a new post, Ashok Leyland-Double Top-Short 4 years, 7 months ago
Two equivalent tops; not equal Tops. The Duration between the two Tops ( A and B in the chart) should be one month.to identify the significance of selling even after one month. Volume should be high in the second
-
Mohan P. wrote a new post, Dow Theory- Two year trend 4 years, 7 months ago
Line chart is used for highlighting the Trend based on Dow Theory. Higher Bottom ; Higher Top; Lower Bottom; Lower Top are marked in the chart. High Volume and Average Volume are marked. Top is the Supply Zone a
-
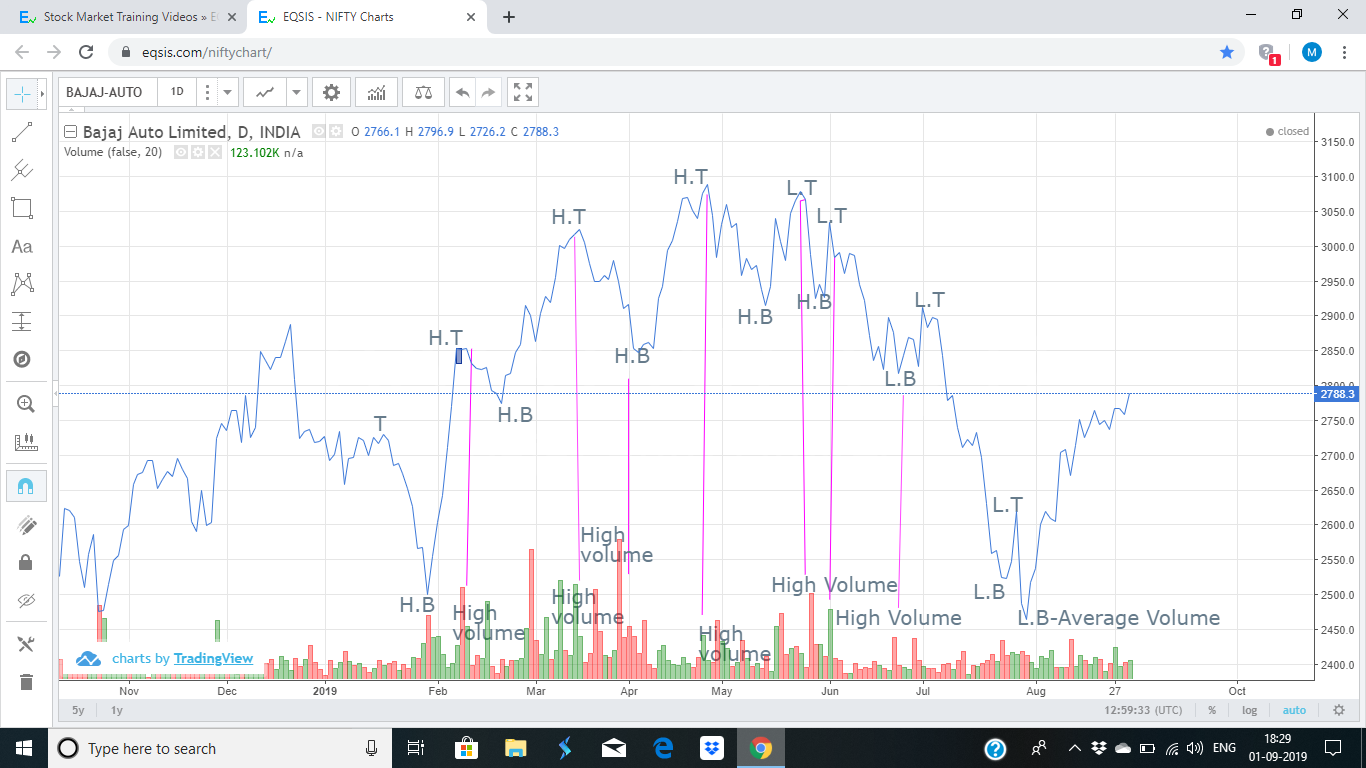
Mohan P. wrote a new post, Bajaj auto-Dow Theory-Two Year Chart 4 years, 7 months ago
Line chart is used for highlighting the Trend based on Dow Theory. Higher Bottom ; Higher Top; Lower Bottom; Lower Top are marked in the chart. High Volume and Average Volume are marked. Top is the Supply Zone a
-
Mohan P. wrote a new post, Bajaj auto-Dow Theory 4 years, 7 months ago
Line chart is used for highlighting the Trend based on Dow Theory. Higher Bottom ; Higher Top; Lower Bottom; Lower Top are marked in the chart. High Volume and Average Volume are marked. Top is the Supply Zone a
-
Mohan P. wrote a new post, Intraday Short Time Trading 4 years, 8 months ago
Inraday is a short time trading. It will follow the sentiments in the Global/Domestic market. Top Down Approach is used for picking a stock. Market Direction( Advance/Decline); Sector Contribution( Index wise
-
Mohan P. wrote a new post, Intraday Short Time Trading 4 years, 8 months ago
Inraday is a short time trading. It will follow the sentiments in the Global/Domestic market. Top Down Approach is used for picking a stock. Market Direction( Advance/Decline); Sector Contribution( Index wise
-
Mohan P. commented on the post, Price Pattern -Double Top/Bottom / Head and shoulder/cup/Flag/Triangle 4 years, 8 months ago
Thank you Mr. Naresh.
-
Mohan P. wrote a new post, Technical Trend Indicators 4 years, 8 months ago
There are two types of Technical Indicators : Moving Average and Relative Strength Index. The indicators are using Algorithm for price movement. Moving average will work in Trending Area and will not work in
-
Mohan P. wrote a new post, GAP 4 years, 8 months ago
There are different kinds of GAP: Area GAP; Breakout GAP, Runaway GAP and Exhaustion GAP. .We can identify the positive or negative movement and also strength of the market using GAP. The followings are some of
-
Mohan P. wrote a new post, Candlestick – DOJI- Morning Star-Evening Star 4 years, 8 months ago
Candlestick is very effective and accurate for a short duration trading . – from 2 days to a week to study the price. The Line will not focus on a particular day price but candlestick will give the correct
-
Mohan P. wrote a new post, Price Pattern -Double Top/Bottom / Head and shoulder/cup/Flag/Triangle 4 years, 8 months ago
The characteristics of price and movement are highlighted in price Patterns. The Different types of Price Patterns are Double Top; Double bottom, Cup Pattern, Flag Pattern and Triangle pattern. It follows
-
Mohan P. wrote a new post, Dow's Trend Theory-Demand and Supply 4 years, 8 months ago
The theory was invented by Charles H Dow . This is the first concept to identify Demand and Supply. He studied the market , price movement and Price characteristics instead of the company.It is a very powerful to
-
Mohan P. wrote a new post, Logic-Analysis-Fundamental – Technical 4 years, 8 months ago
. The stock should be picked based on some logic. The logic needs some analysis. The widely accepted analysis are Fundamental and Technical Analysis. The Fundamental Analysis talks about the company.Though it is a
-
Mohan P. wrote a new post, Derivative instruments 4 years, 8 months ago
Future /option trades are very interesting as well as risky trade . No huge investment is needed to enter into the trade. With premium and margin money , the contract can be entered between the buyer and seller.
-
Mohan P. wrote a new post, Trade Plan 4 years, 8 months ago
In this module , we will come to know how the stock price is decided by the Buyer / seller in the exchange and What is the trade plan . We also come to know how the target price, Entry Level , Unit ,and Stop
- Load More