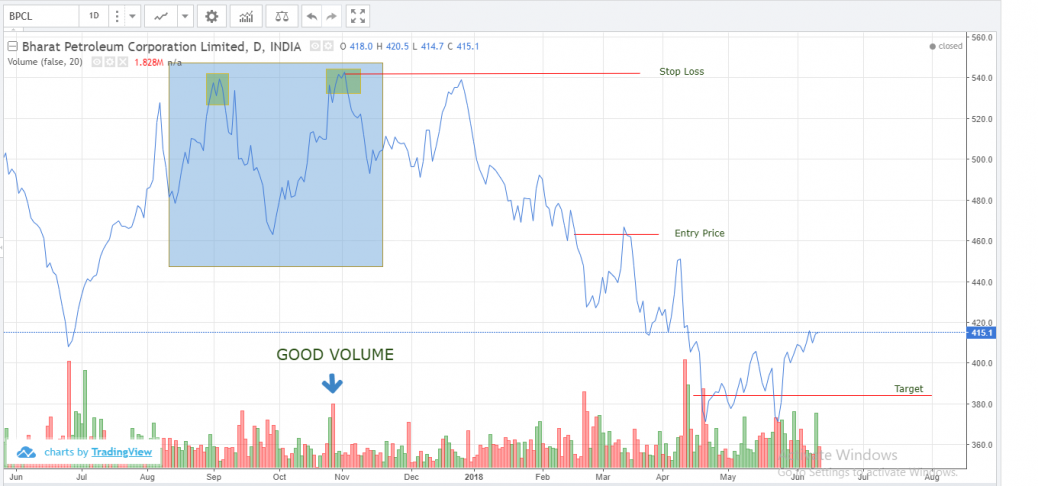
In this analysis, the theory of double top is explained with the help of a chart as given above. In this analysis, the formation of double top happens during the period from September 2017 to October 2017. The volume in the second highest peak is supported by good volume. Hence we can conclude that it forms the pattern of double top during this period and the appropriate stop loss, target price and the entry price where the trader has to create a short position by entering into the market at Rs 463.10. The stop loss is the point of the second highest peak which is estimated to be around Rs 542, and the target price assuming the risk taken by the trader is equal to the reward taken should be around Rs 384.20 which is the price at which the seller has to square off his position by buying the stock to make profit. If we observe carefully the two tops are distinctly marked separately which can also be called as the resistance levels are essential in the formation of the Double Top shape.
Double Top – BPCL – Bearish
feel free to call us +919500077790 info@eqsis.com
0 Comments
Stock Analysis
M | T | W | T | F | S | S |
---|---|---|---|---|---|---|
1 | 2 | 3 | 4 | 5 | ||
6 | 7 | 8 | 9 | 10 | 11 | 12 |
13 | 14 | 15 | 16 | 17 | 18 | 19 |
20 | 21 | 22 | 23 | 24 | 25 | 26 |
27 | 28 | 29 | 30 | 31 |
Bullish View
Bearish View
- Bearish-GAP-SHORT-BICON-25-10-2019 October 25, 2019
- FEDERAL BANK – BEARISH ENGULFING October 17, 2019
- Cummins India – Bearish Engulfing – 24Sep19 September 25, 2019
- Day29-Tata Motors DVR – Bearish Piercing – 12Sep19 September 12, 2019
- Day27-Bearish-Engulfing pattern-Tech Mahindtra-09Sep19 September 10, 2019
How this forum help stock traders?
Stock Trading is business, the success depends not just on capital or subscribing advisory services or participating workshops. The factors such as your awareness level about business, Efforts and your contributions, Smartness, Knowledge in analysis and trading instrument, availability of infrastructure and emotional control determine your success.