
The Double Bottom theory is an analysis that is used to determine the trend in the prices of the stock and estimate the appropriate stop loss, entry price and target price. In this analysis, when the shape of the stock pattern involves two similar kind of support levels or bottoms in the shape of ‘W’, then we can conclude that the formation is a double bottom. The minimum number of months to be taken for the study is two months.
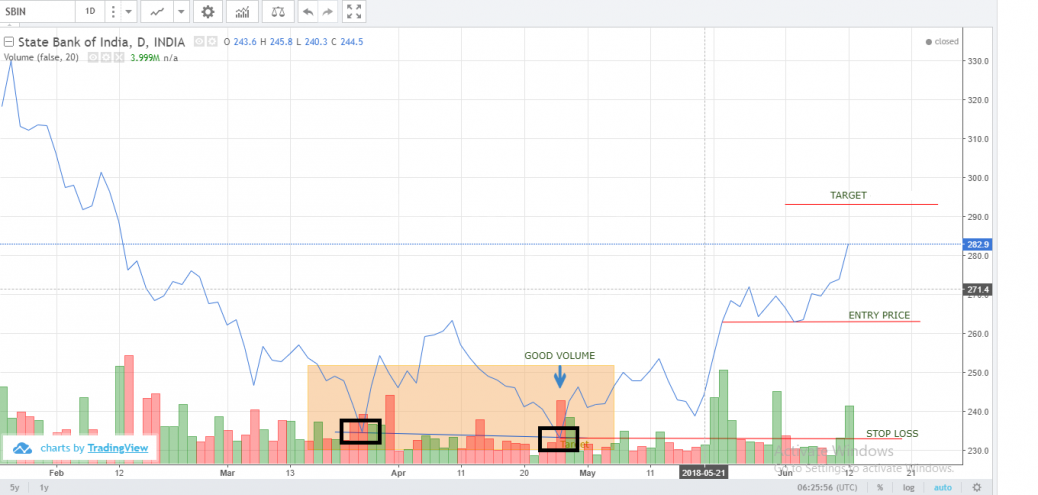
In the above mentioned chart, the company taken for application of the theory is State Bank Of India. It is observed that during the period of April 2018 and May 2018, there were two similar bottoms of support levels at around the price level Rs 233. Also, the volume of stocks traded in the second bottom is high, and therefore, the formation can be concluded as a Double Bottom Theory. The entry price for the buyer to take a long position is the point where the line cuts from below the previous high point i.e. 263.10. Since the trend is bullish soon after hitting the support level, the trader has to take a long position at the previous highest point i.e. 263.10. Since the rewards = risk taken by the buyer the target price shoulde be Rs 293.20 ( 263.10+31.20).


