
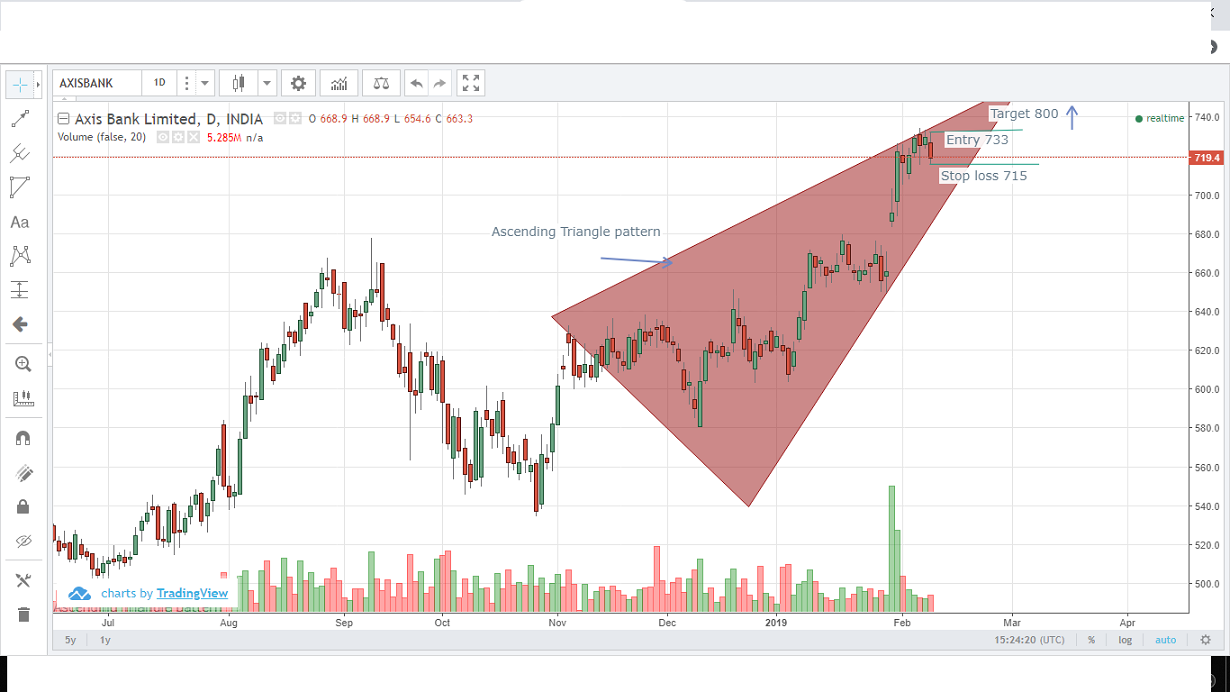
Ascending triangle which is a bullish chart pattern is formed in Axis Bank which usually forms during the uptrend...
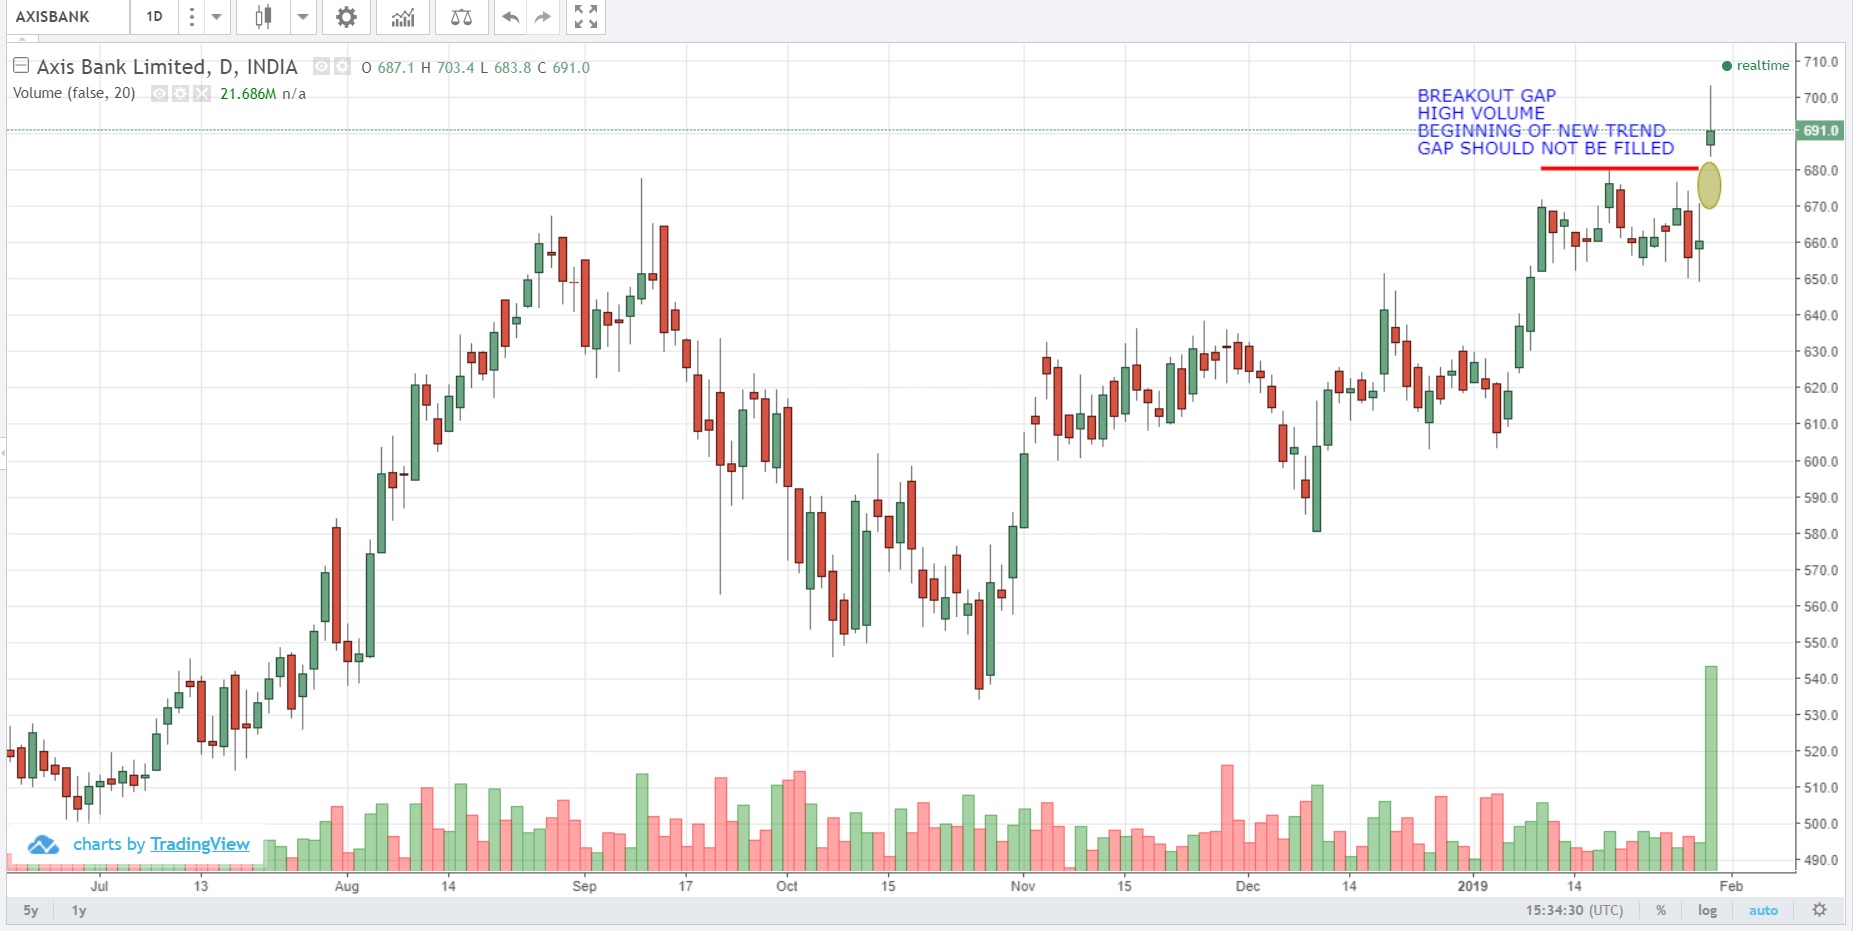
Stock broken out its resistance with gap with high volume indication beginning of new trend.
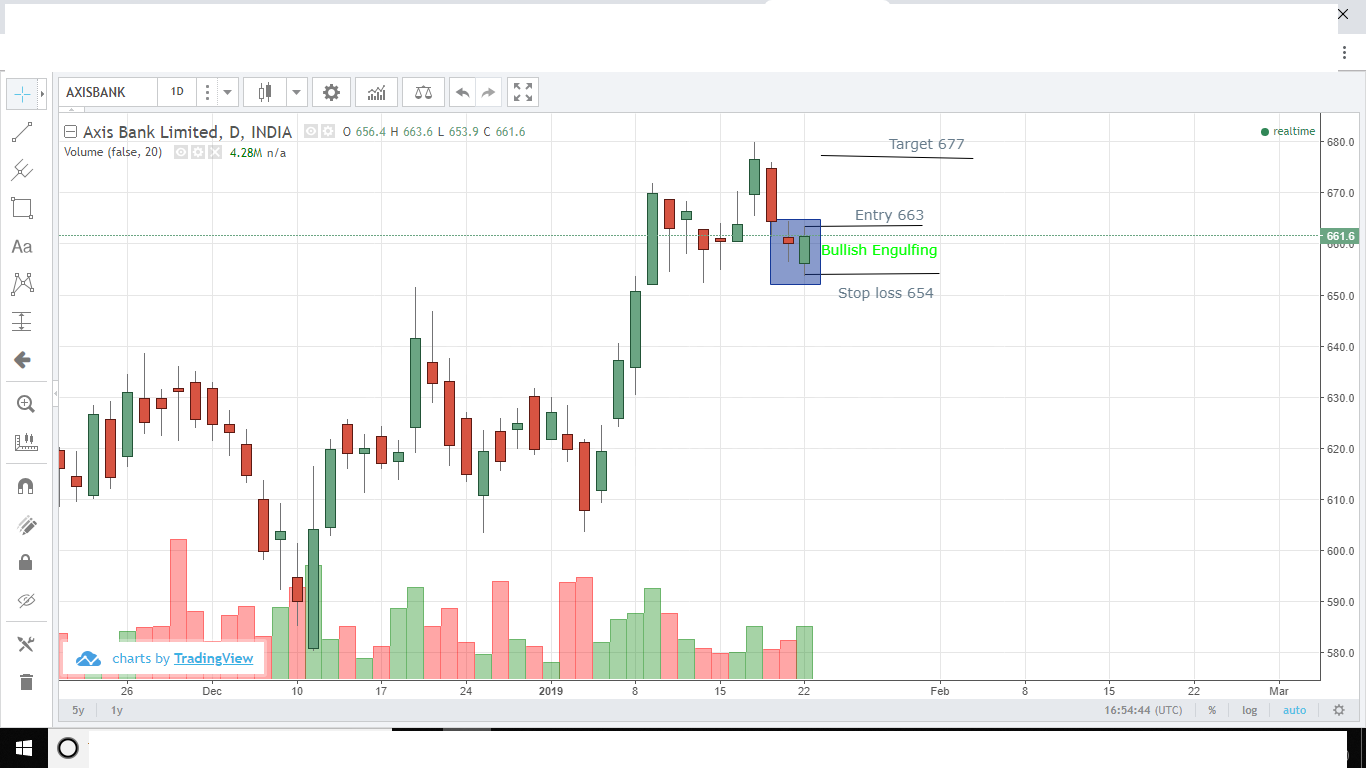
Bullish Engulfing candle pattern is formed by axis Bank after downtrend with volume.
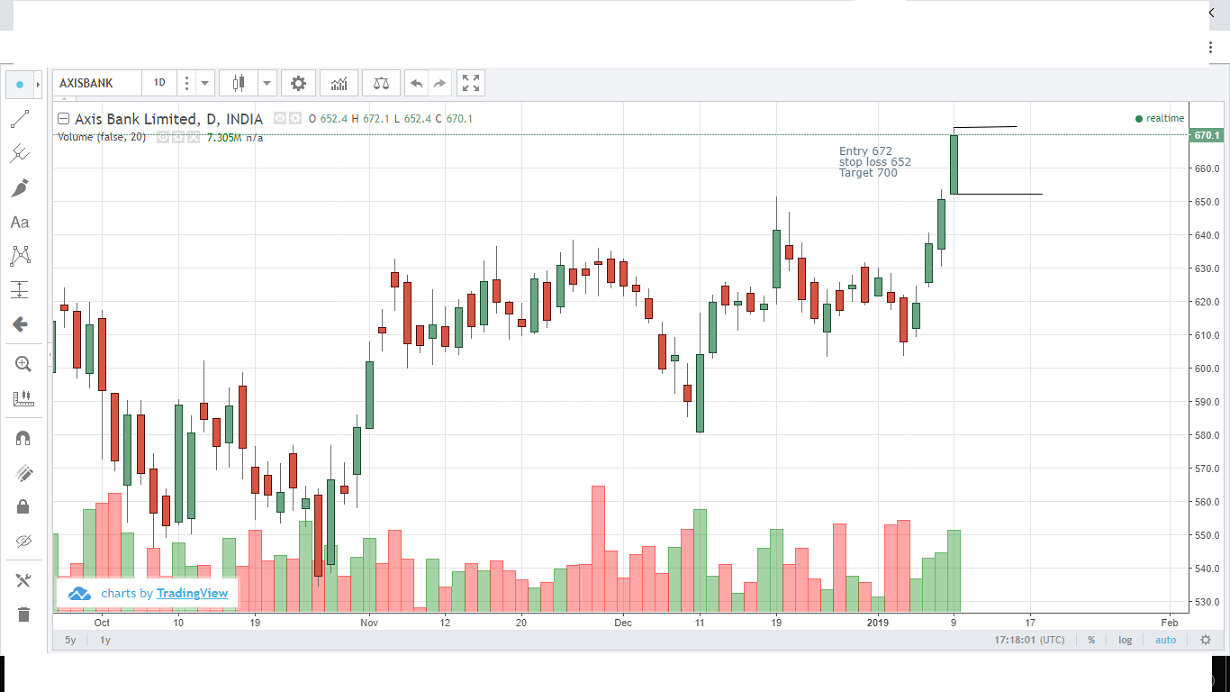
Axis Bank again crosses the resistance level and it is in bullish trend and can expect further movement with...
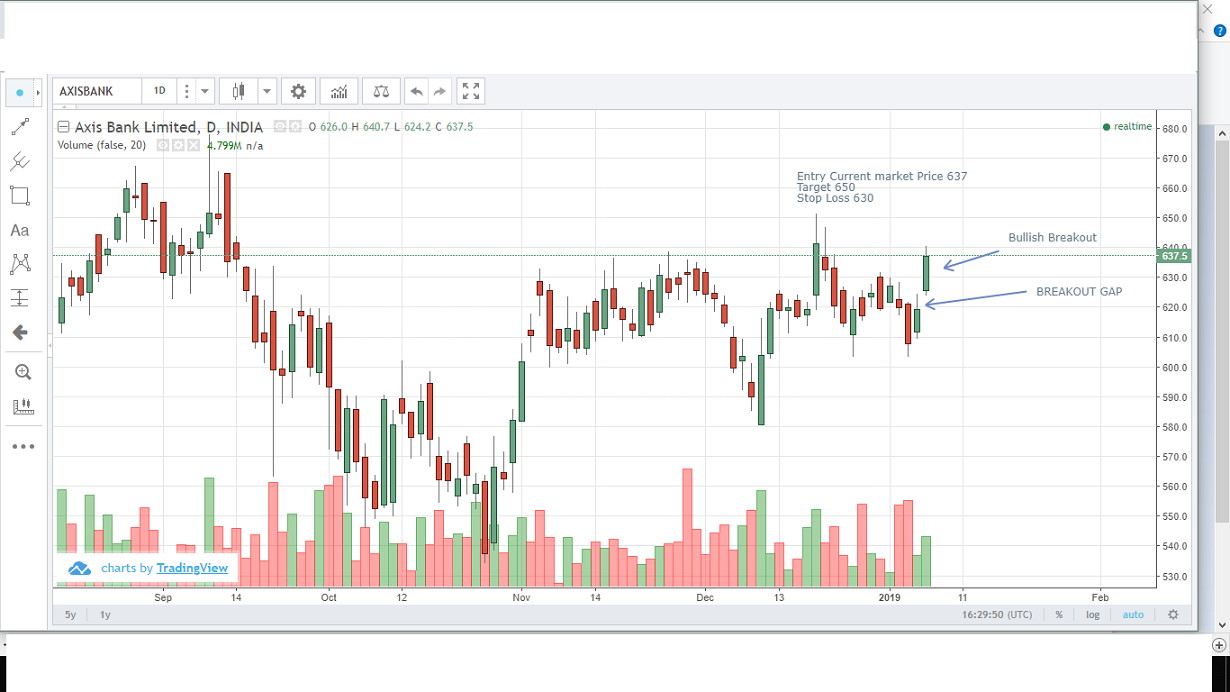
Breakout gap appeared giving breakout when opening in today trade and bullish candle is formed with high volume.
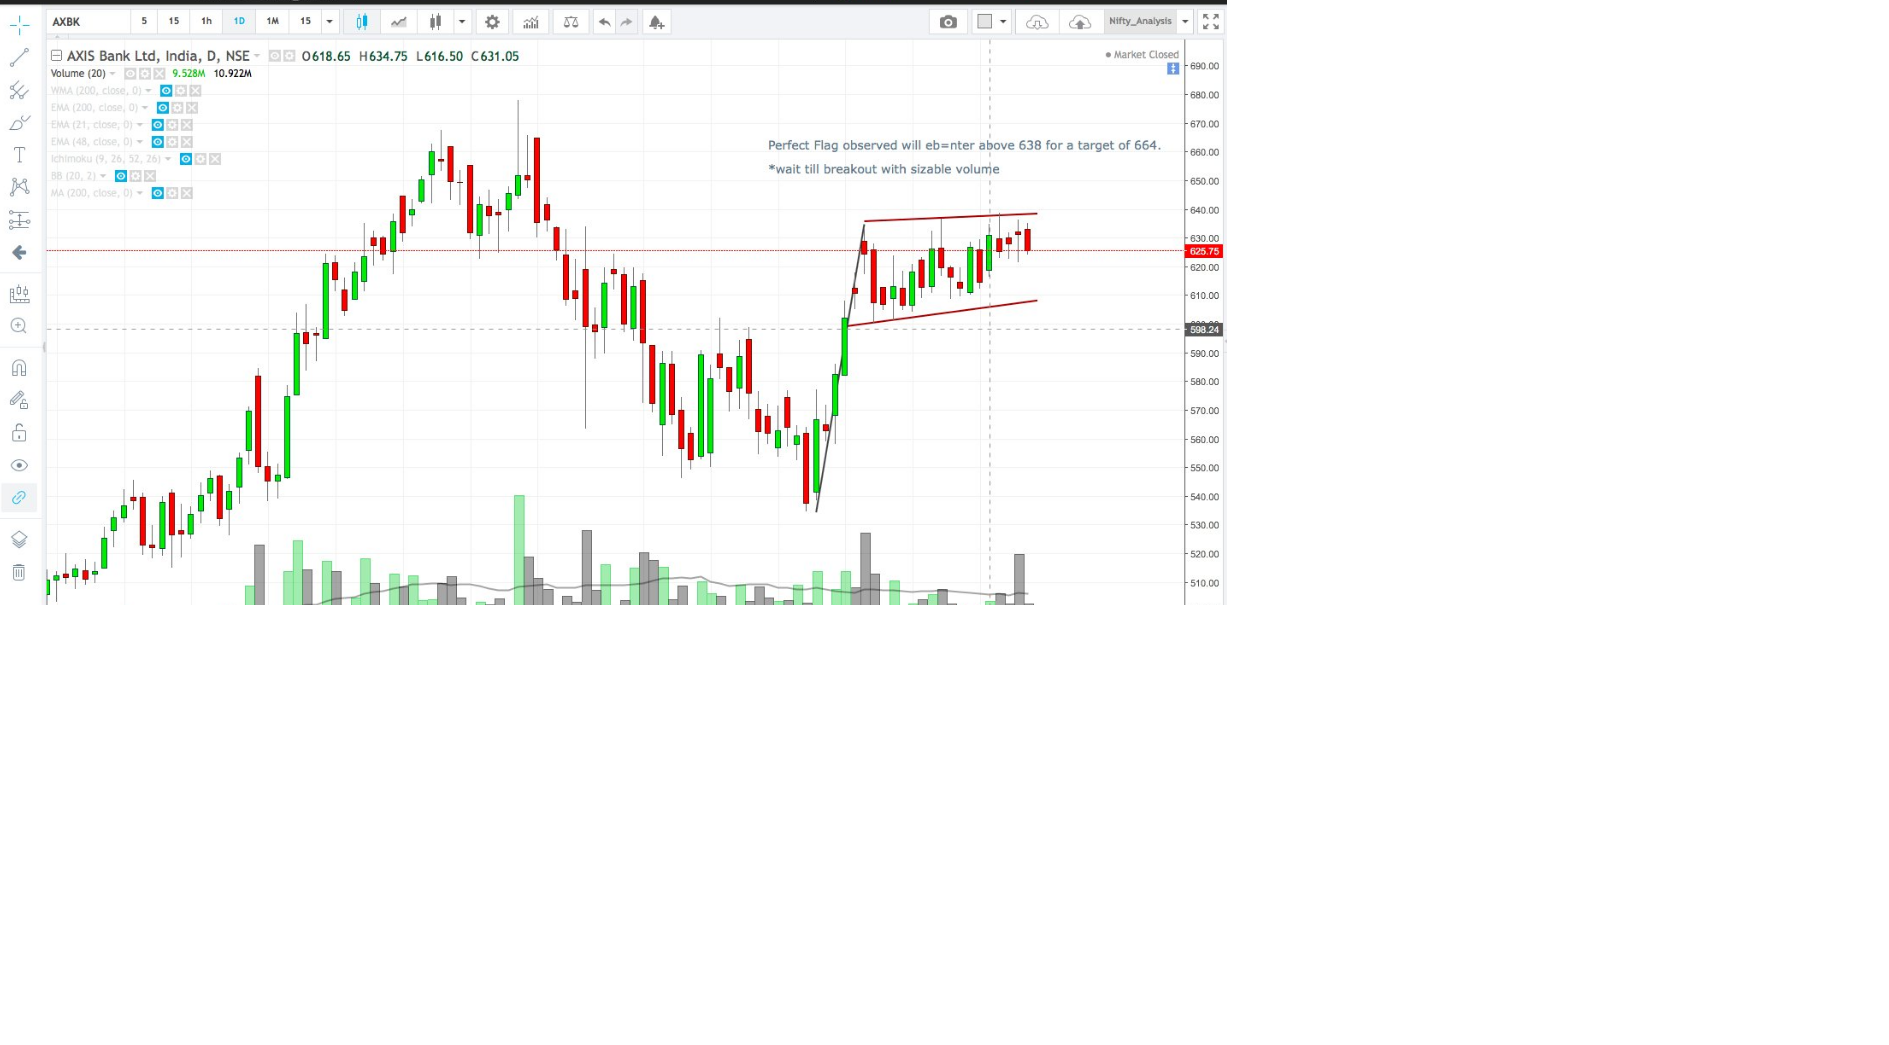
Noticed a flag pattern where we can take a long position.
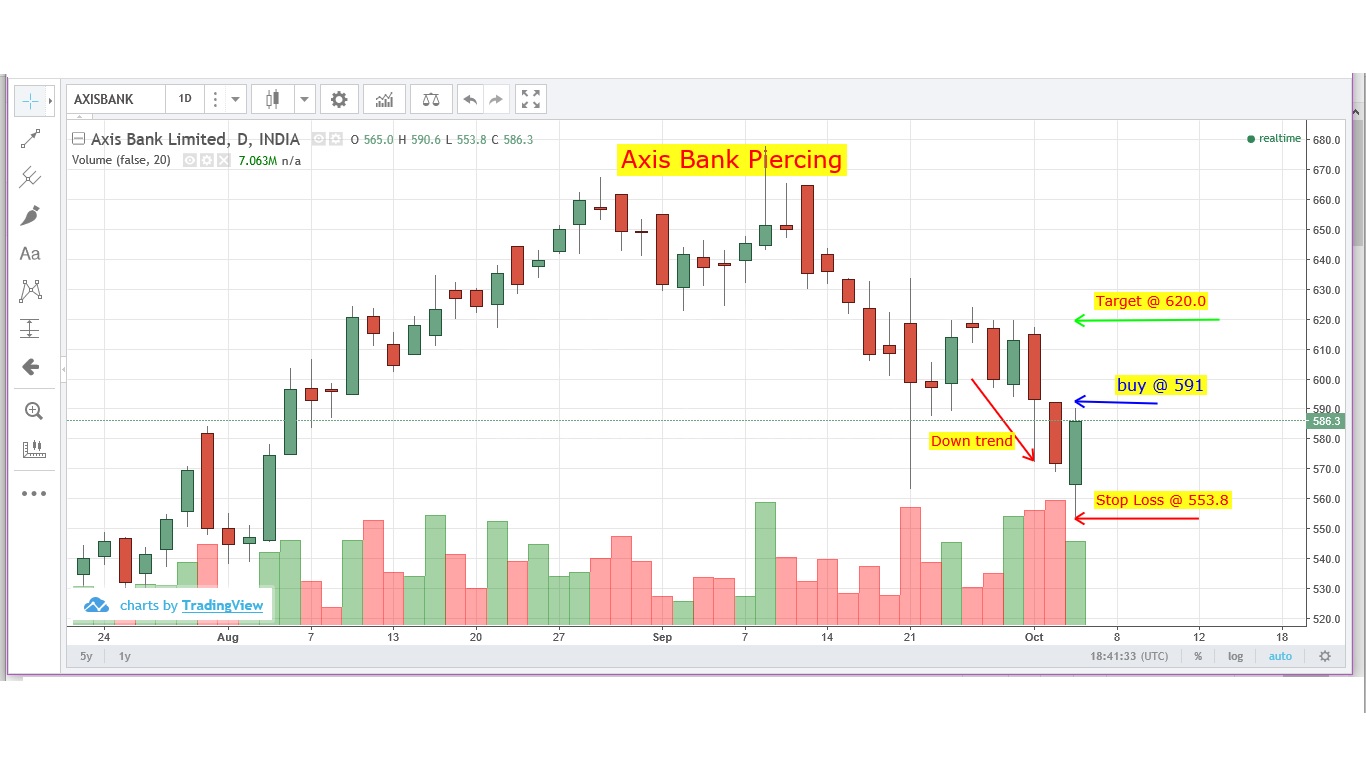
With given down trend of Axis Bank for last few days, today (4th Oct 2018) it showed Bullish view...
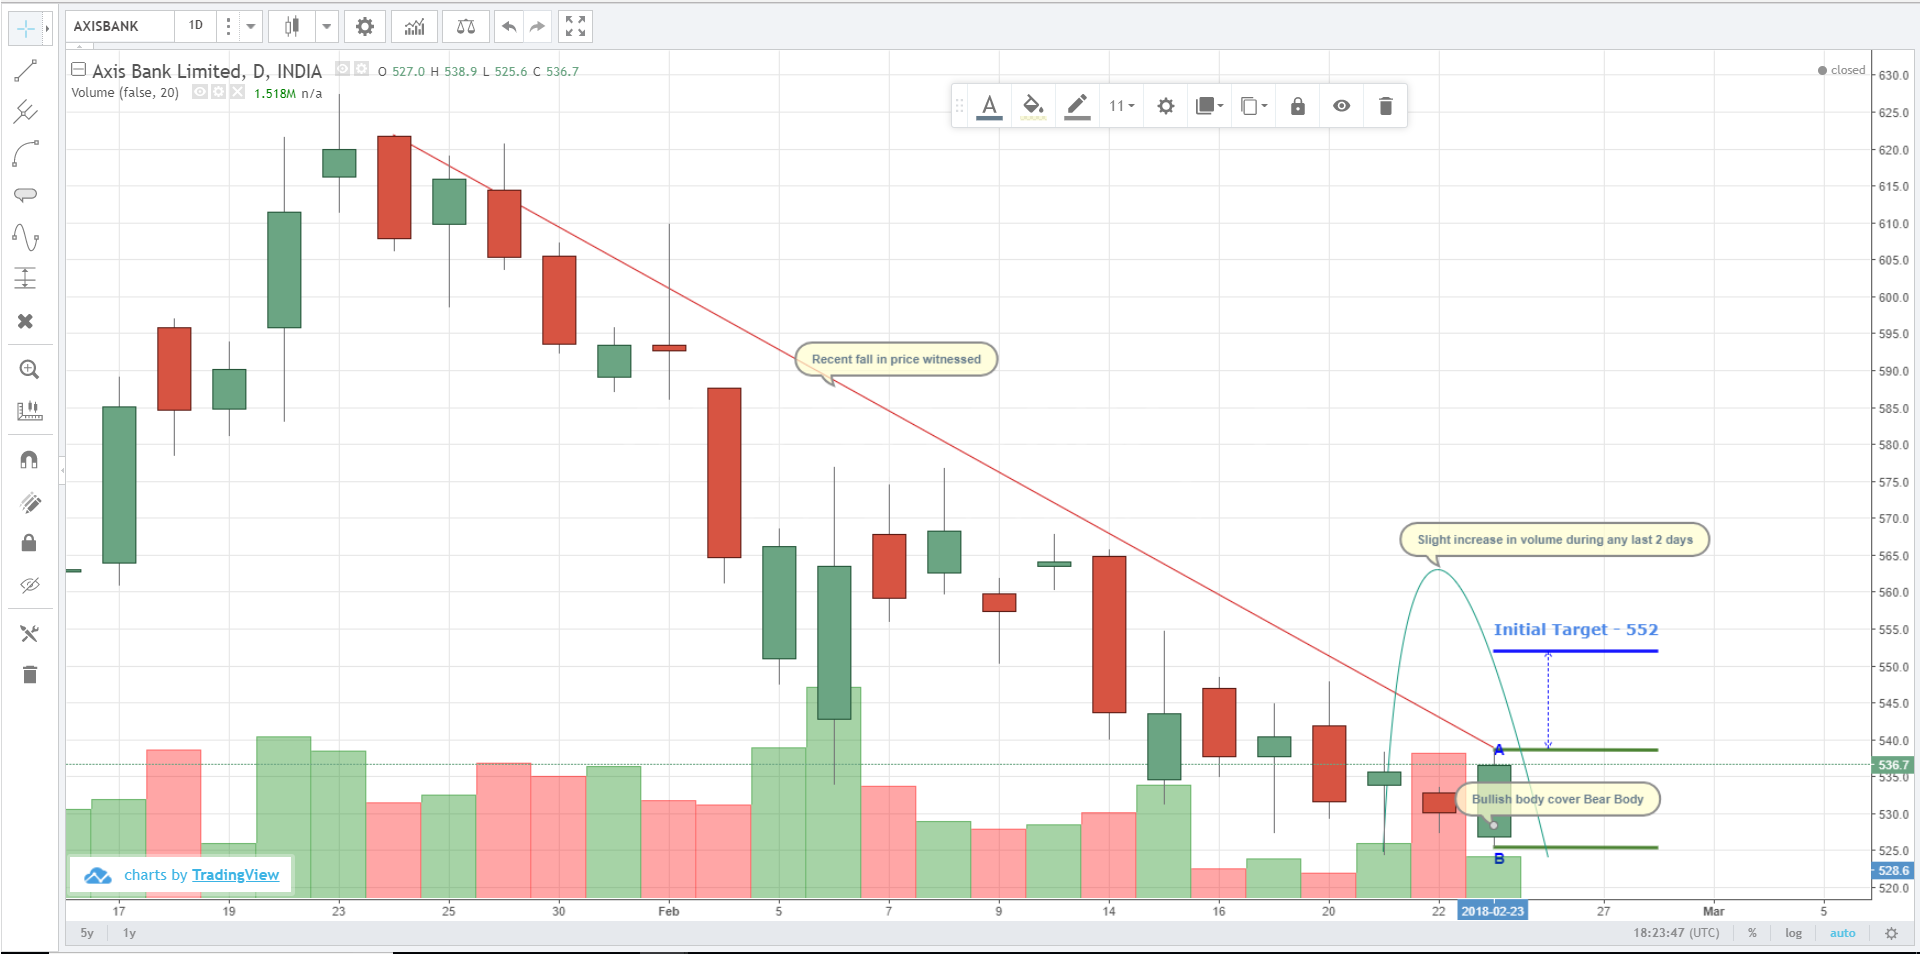
After a fall in price from 620 to 530 (~14.5%), bullish engulfing pattern has been observed. slight increase in...
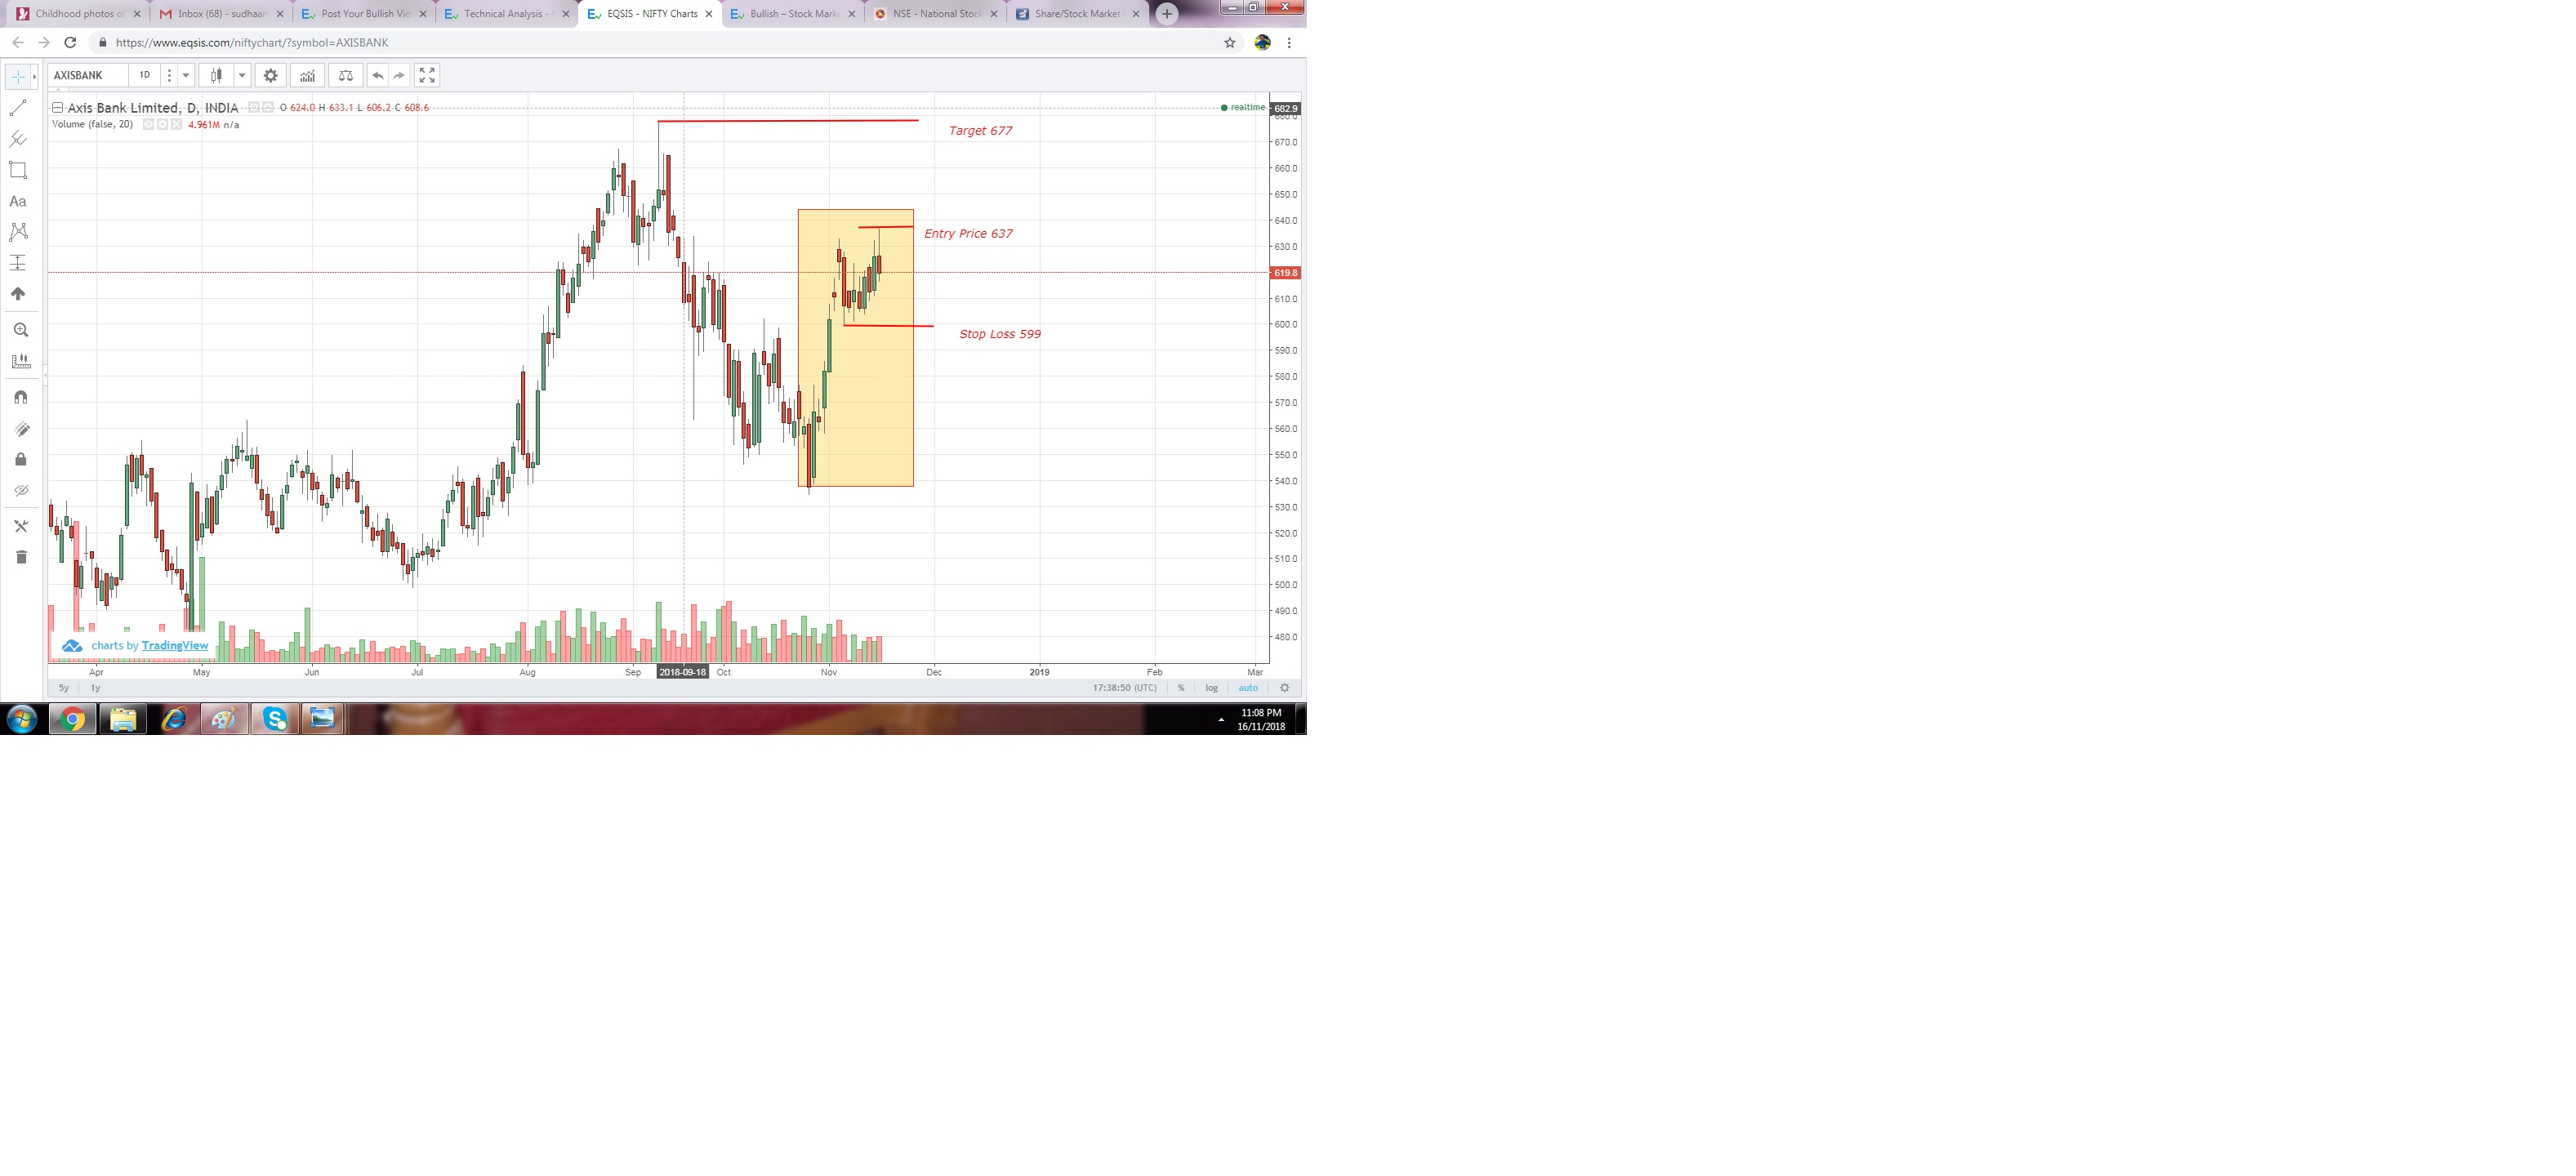
AXIS BANK IS NEAR TO ITS 52 WEEKS HIGH HAVE GOT A STRONG PRICE MOVE IF IT HOLD ABOVE...
Recently Active Members
Bullish View


Bearish View
-
 Bearish-GAP-SHORT-BICON-25-10-2019 October 25, 2019
-
 FEDERAL BANK – BEARISH ENGULFING October 17, 2019
-
 Cummins India – Bearish Engulfing – 24Sep19 September 25, 2019
-
 Day29-Tata Motors DVR – Bearish Piercing – 12Sep19 September 12, 2019
-
 Day27-Bearish-Engulfing pattern-Tech Mahindtra-09Sep19 September 10, 2019