
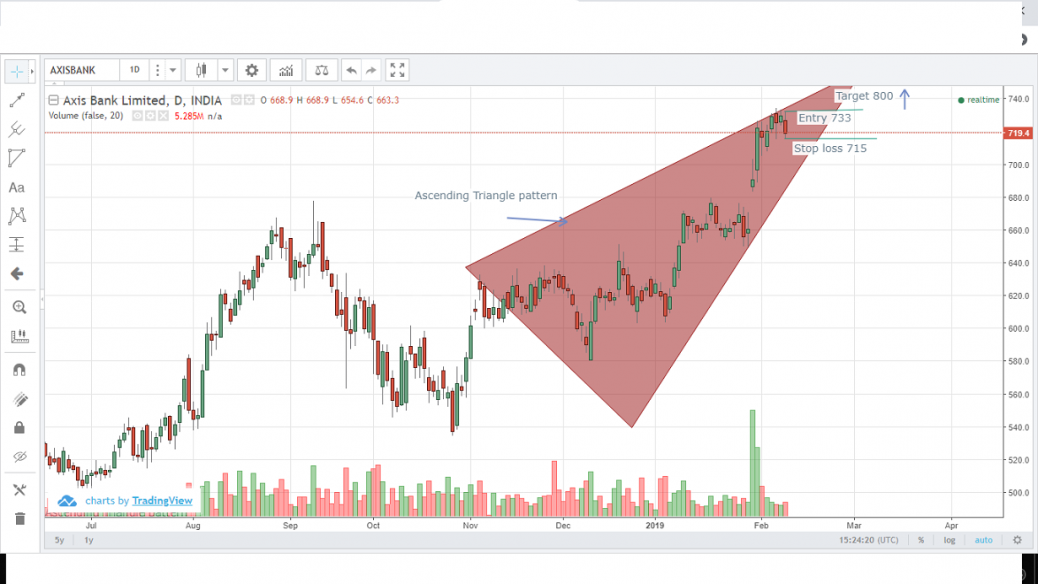
Ascending triangle which is a bullish chart pattern is formed in Axis Bank which usually forms during the uptrend with continuation pattern.
feel free to call us +919500077790 info@eqsis.com
Ascending triangle which is a bullish chart pattern is formed in Axis Bank which usually forms during the uptrend with continuation pattern.
| M | T | W | T | F | S | S |
|---|---|---|---|---|---|---|
| 1 | 2 | 3 | 4 | 5 | 6 | 7 |
| 8 | 9 | 10 | 11 | 12 | 13 | 14 |
| 15 | 16 | 17 | 18 | 19 | 20 | 21 |
| 22 | 23 | 24 | 25 | 26 | 27 | 28 |
| 29 | 30 | |||||
 Bearish-GAP-SHORT-BICON-25-10-2019 October 25, 2019
 FEDERAL BANK – BEARISH ENGULFING October 17, 2019
 Cummins India – Bearish Engulfing – 24Sep19 September 25, 2019
 Day29-Tata Motors DVR – Bearish Piercing – 12Sep19 September 12, 2019
 Day27-Bearish-Engulfing pattern-Tech Mahindtra-09Sep19 September 10, 2019
Stock Trading is business, the success depends not just on capital or subscribing advisory services or participating workshops. The factors such as your awareness level about business, Efforts and your contributions, Smartness, Knowledge in analysis and trading instrument, availability of infrastructure and emotional control determine your success.
EQSIS, A Stock Market Research Firm
Knowledge is Power. Here you may start from basics, get support while practicing and evolve as active analyst, later you can become a pro


Hi,
This is not an appropriate triangle pattern. Read the below description “I hope this will help you”
• The stock has a breakout-gap with high volume in the daily chart on Jan30, 2019.
• The stock moved past the major resistance and currently hovering at an all-time high.
• The immediate Support is around 650 level.
• The stock is well placed above 21 day moving average.
• Additionally, the stock has been in a strong uptrend after the outcome of Q3 result.