
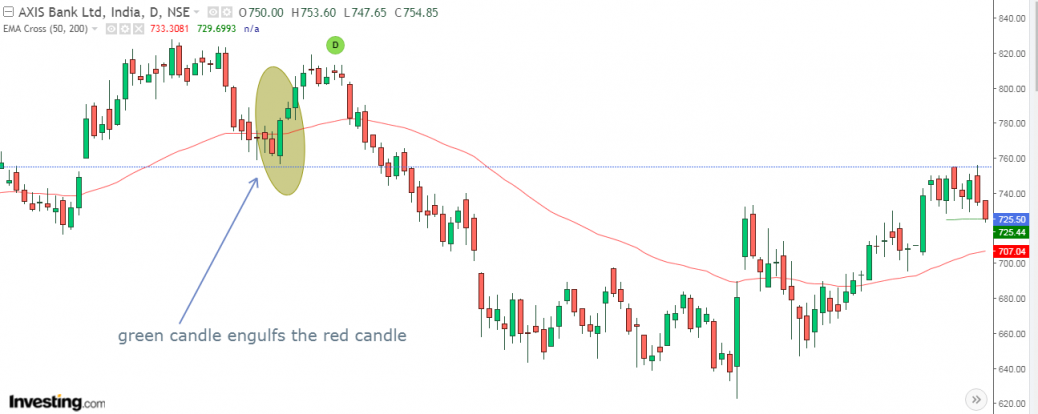
The bullish engulfing pattern is a two-candle reversal pattern. The second candle completely ‘engulfs’ the real body of the first one, without regard to the length of the tail shadows. The Bullish Engulfing pattern appears in a downtrend and is a combination of one black or dark(red) candle followed by a larger white or hollow(green) candle. On the second day of the pattern, price opens lower than the previous low, yet buying pressure pushes the price up to a higher level than the previous high, culminating in an obvious win for the buyers. A bullish engulfing pattern can be identified when a small black candlestick, showing a bearish trend, is followed the next day by a large white candlestick, showing a bullish trend, the body of which completely overlaps or engulfs the body of the previous day’s candlestick. the stock must open at a lower price on Day 2 than it closed at on Day 1.In attached chart the green candle engulfs the red candle and. It starts from lower of the red candle and then fully covers the red candle and closes at the highest point of the day.


Hi sir,
Your work is really good…. keep doing this
Nice analysis !