
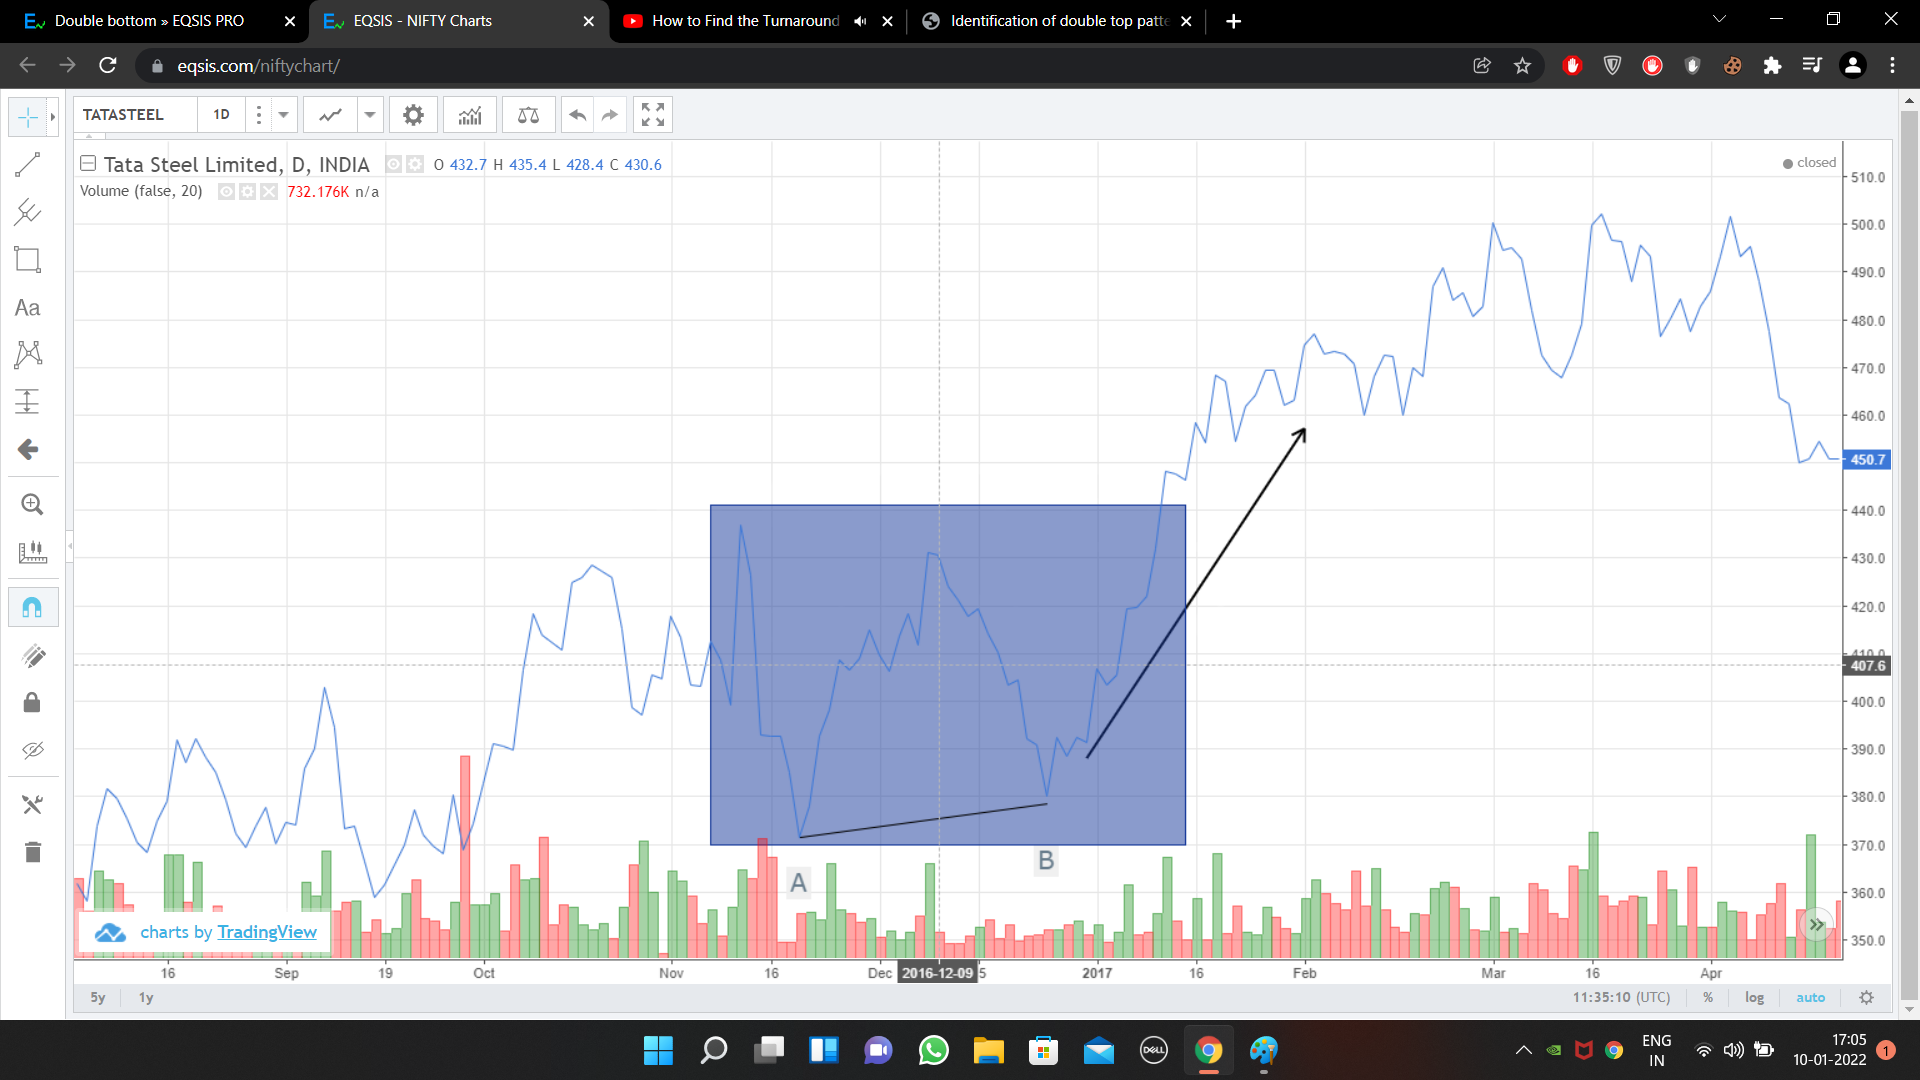
here i witnessed a double bottom which is “w” shaped with same or almost same price it indicate a...
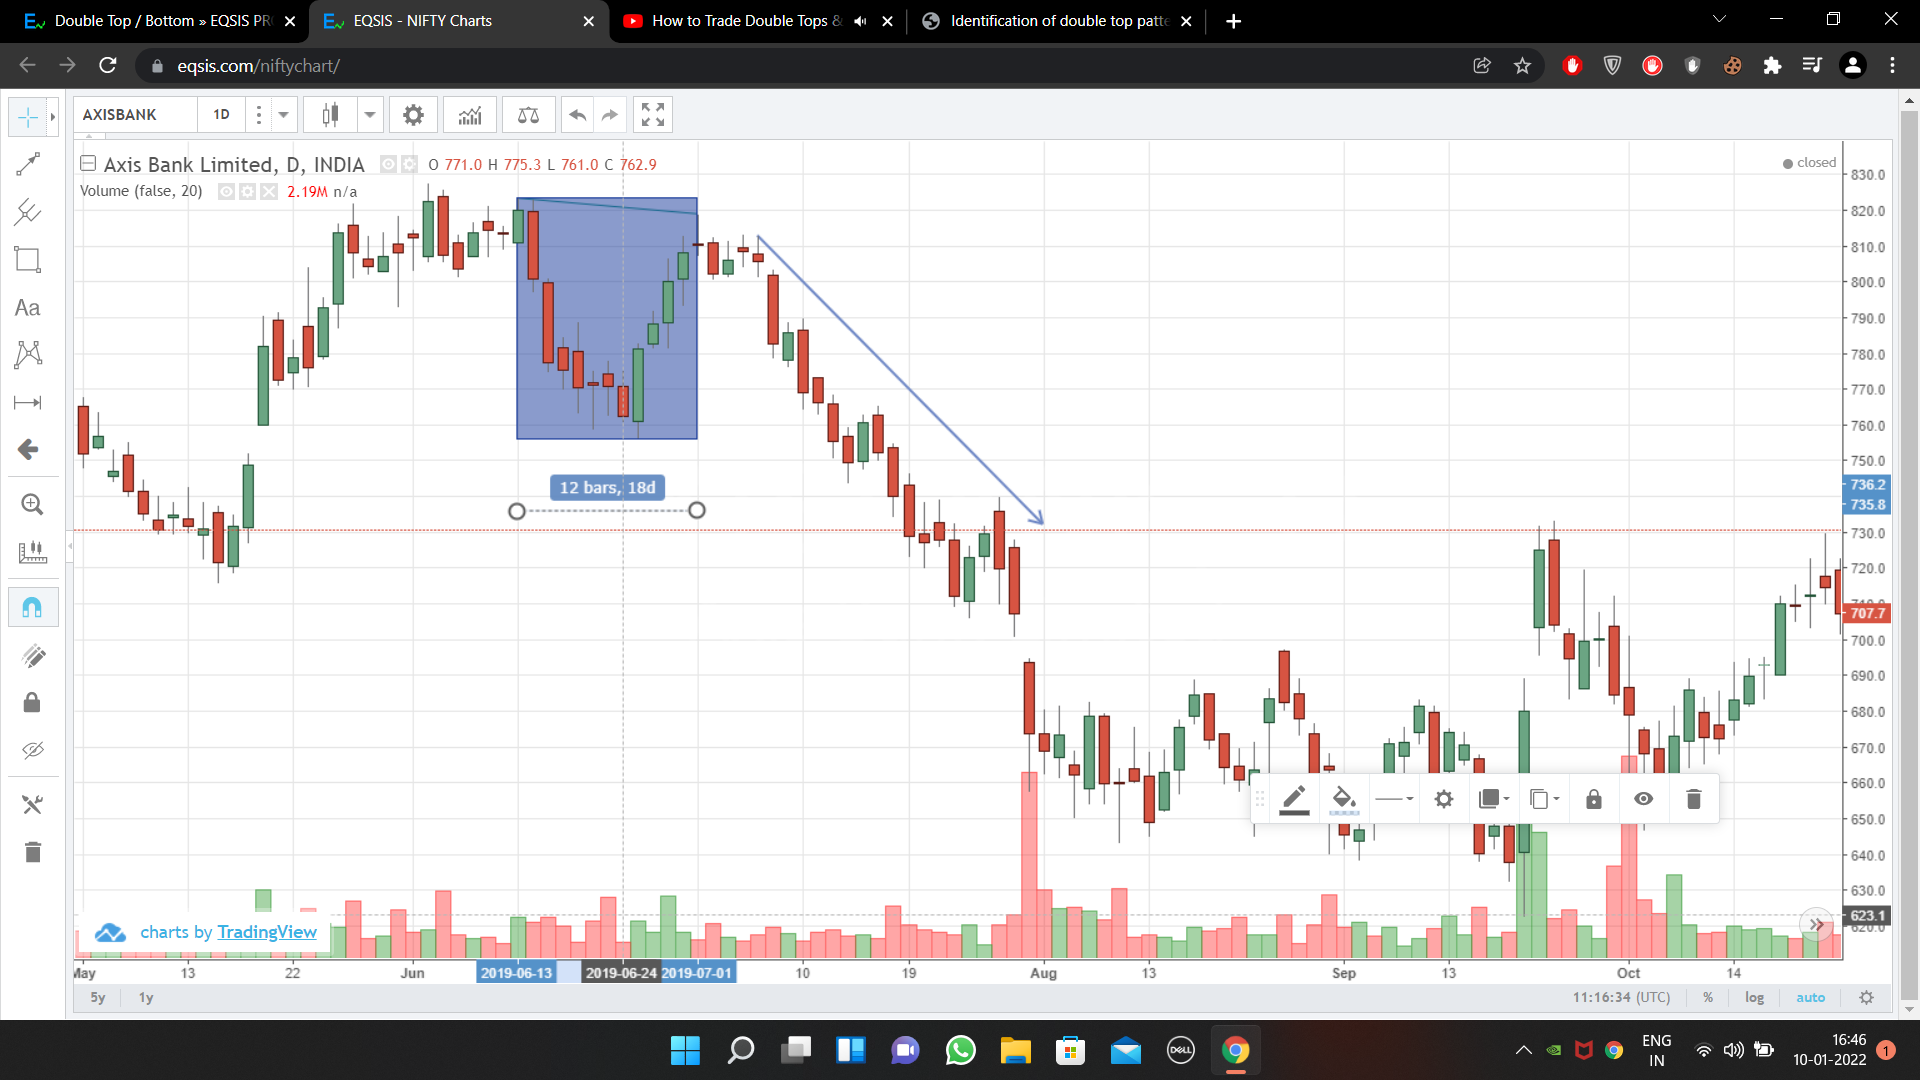
witness a double top it is a shape of “M”it can be similar price around the same price it...
Basics of Stock Trading
Stock Market Trading Stock Market Exchange (NSE & BSE) Stock Market Types of Ordering Long, Short, Long Unwinding and...
Fundamentals of Dow theory
Dow theory is the most fundamental theory which lays the foundation for the technical analysis. Based on the demand...
Understanding Supply & Demand through Dow Theory.
Understanding the supply and demand zone to confirm the trend of the stock. Dow theory plays an essential role...
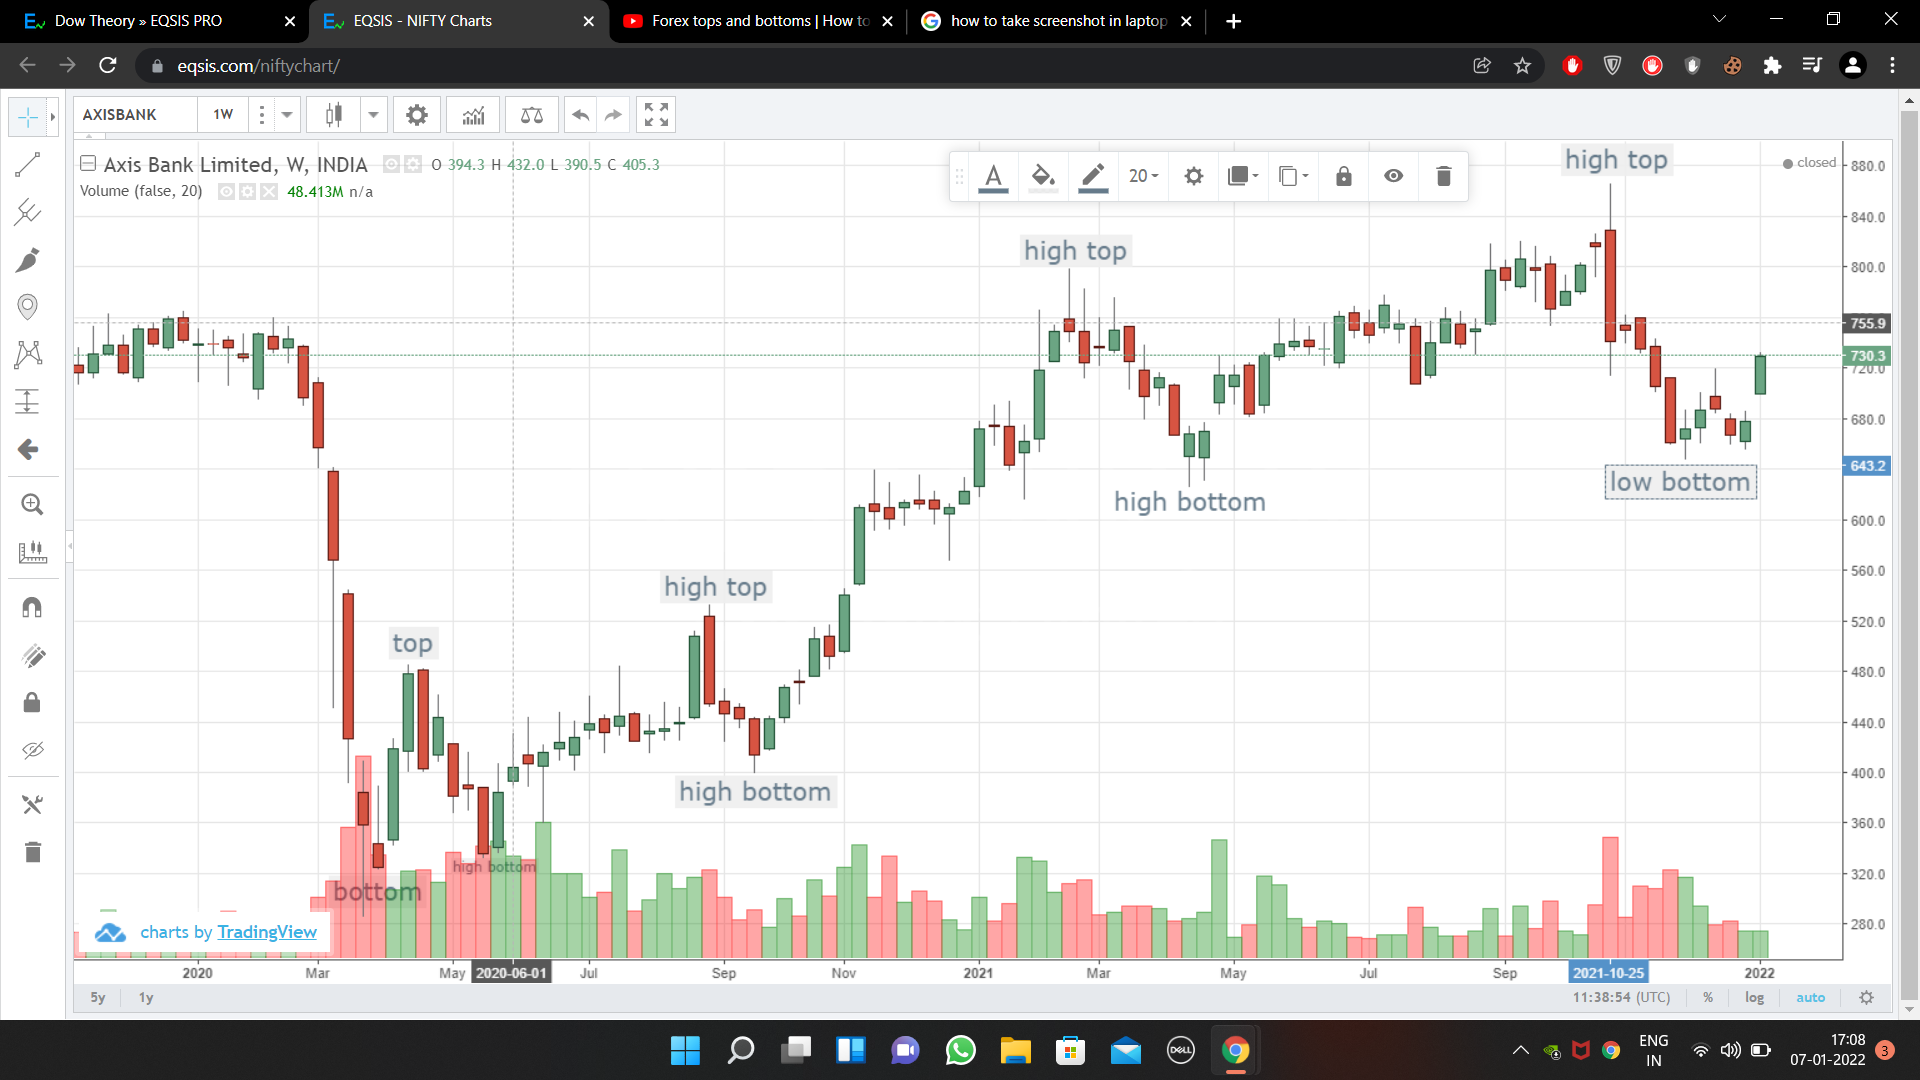
we should first mark the tops,bottom,high top and high bottom,low top and low bottom this a the first thing...
Intraday analysis is to analyse the market situation and price movement to make profit for buying and selling the...
Dow theory- Demand and supply.
Dow theory- supply zone- S > D = BEARISH = SELL. demand zone- D > S = BULLISH= BUY.
stock-fundamental and technical analysis
fundamental and technical analysis- pros and cons; candlestick chart.
Technical indicators
A technical indicator is a mathematical pattern derived from historical data used by technical traders or investors to predict...
Recently Active Members
Bullish View


Bearish View
-
 Bearish-GAP-SHORT-BICON-25-10-2019 October 25, 2019
-
 FEDERAL BANK – BEARISH ENGULFING October 17, 2019
-
 Cummins India – Bearish Engulfing – 24Sep19 September 25, 2019
-
 Day29-Tata Motors DVR – Bearish Piercing – 12Sep19 September 12, 2019
-
 Day27-Bearish-Engulfing pattern-Tech Mahindtra-09Sep19 September 10, 2019