
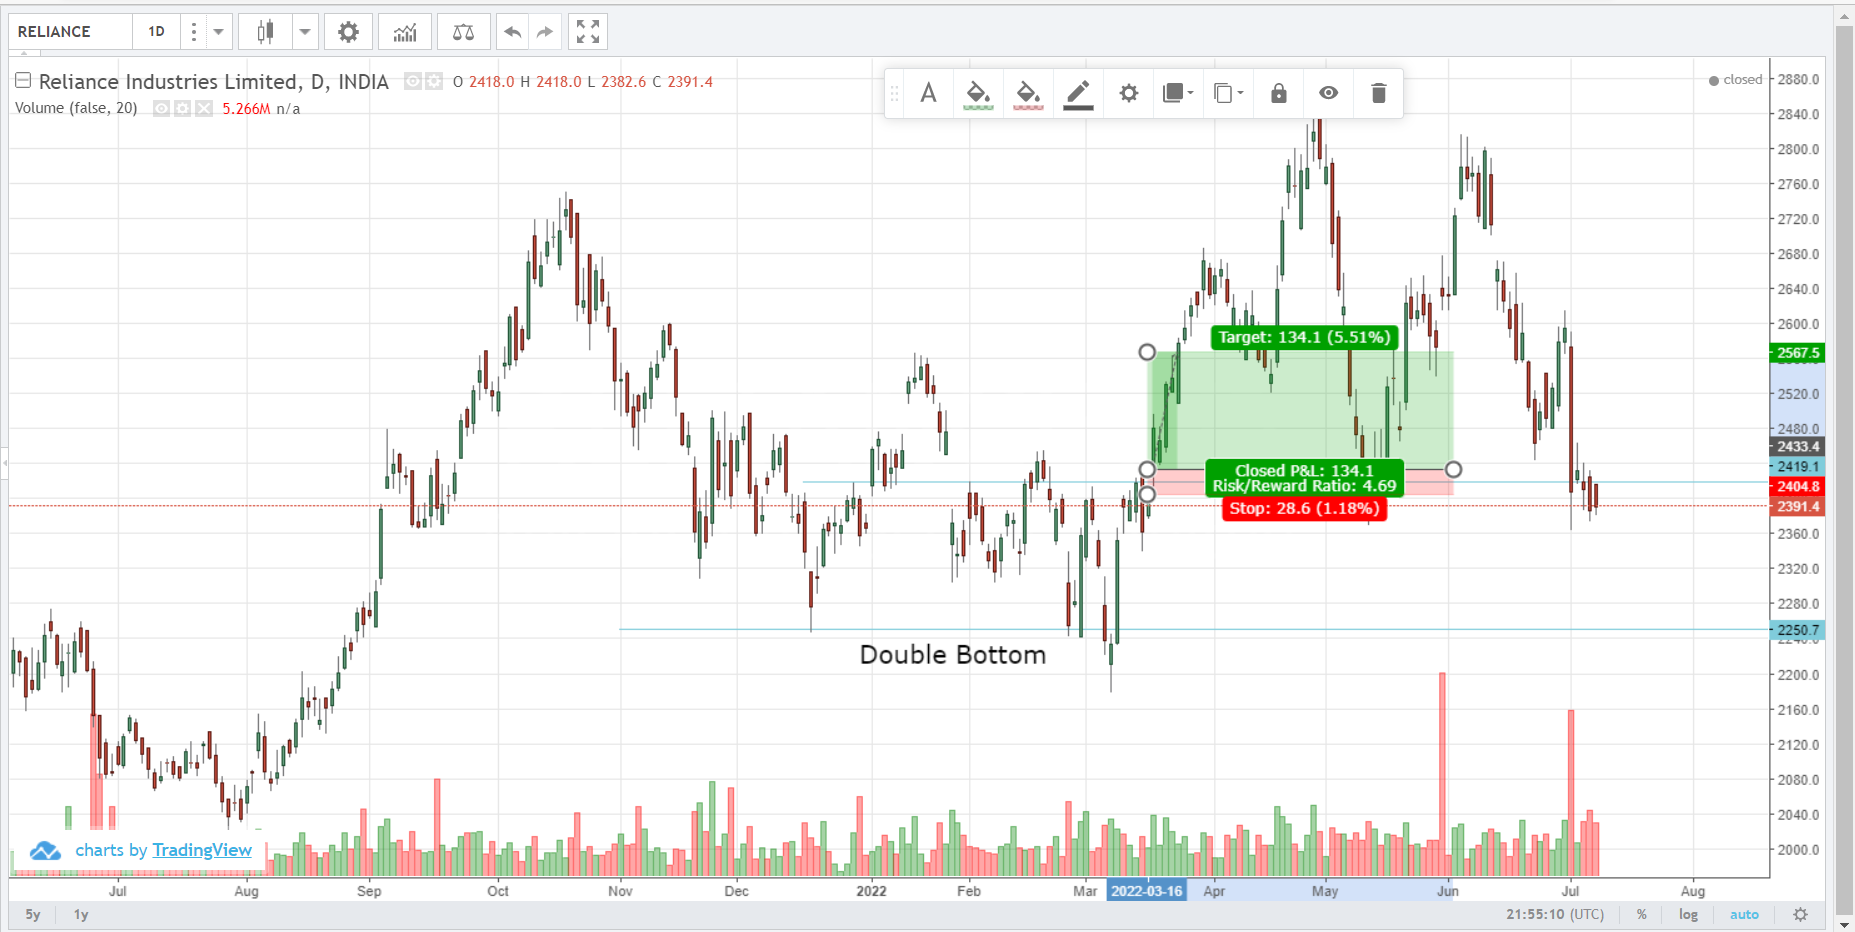
Double Bottom – Reliance Previous Resistance is broken at 2419 Can buy Open hammer Candle with good volume @...
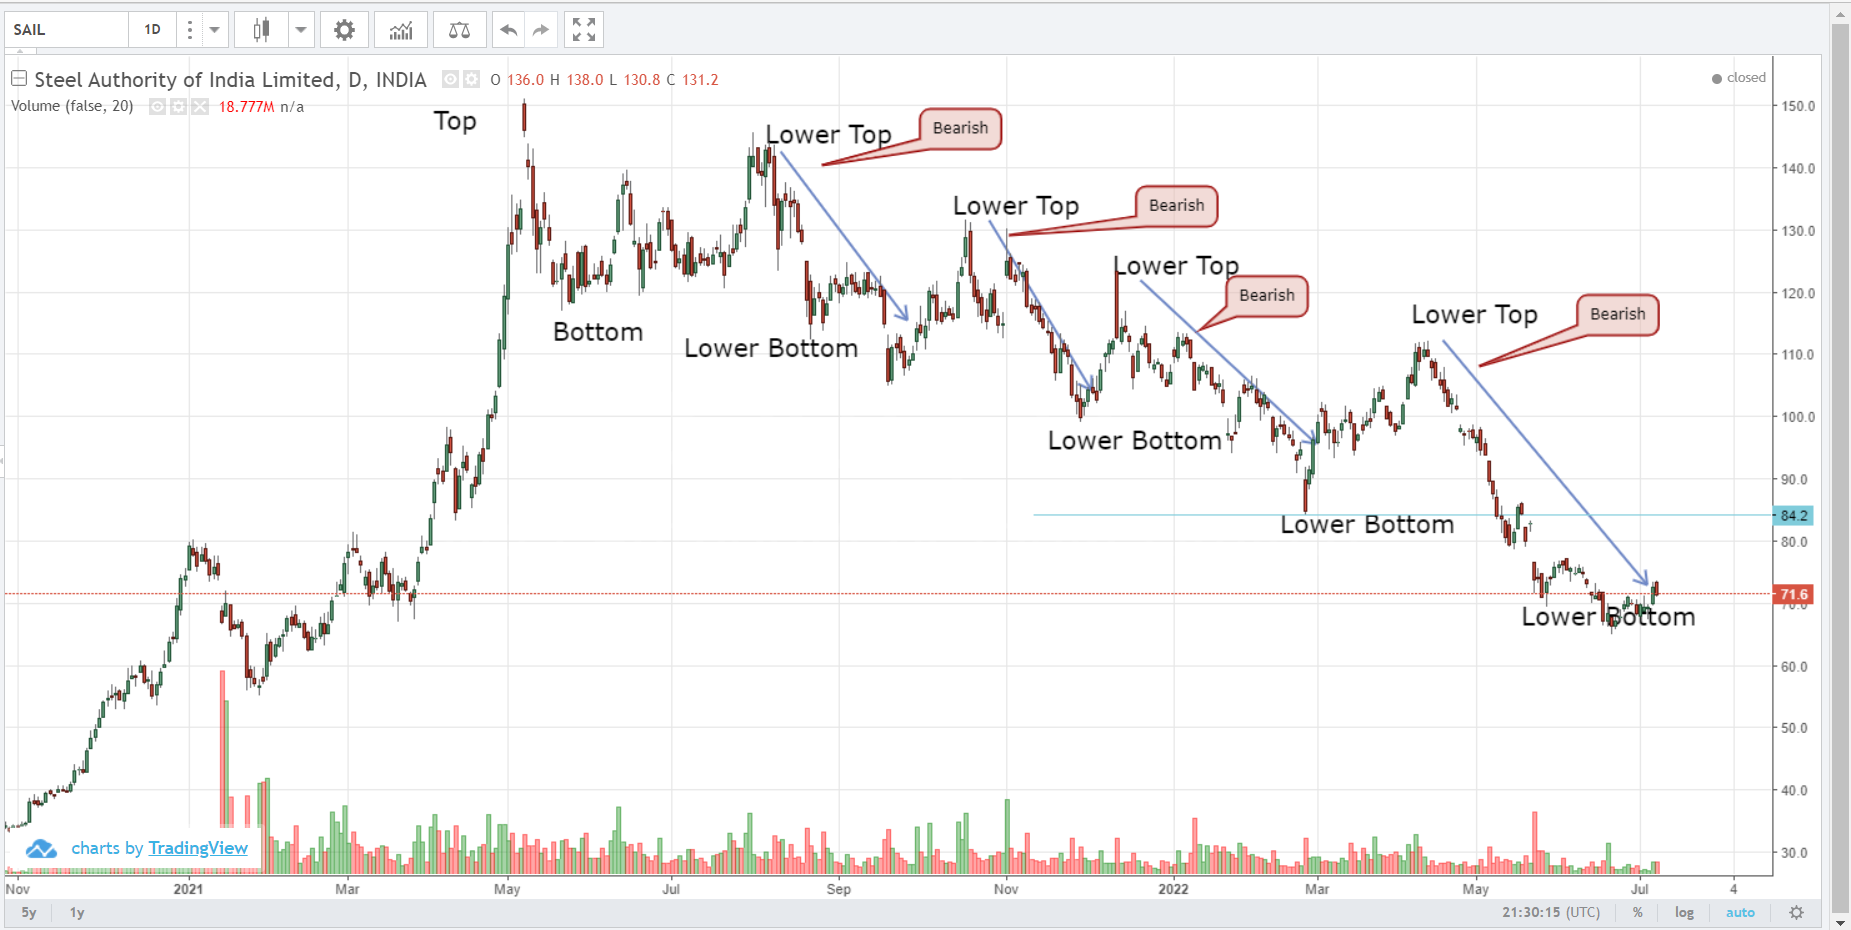
Dow Theory – Bearish View Sail From May 2022 till Date
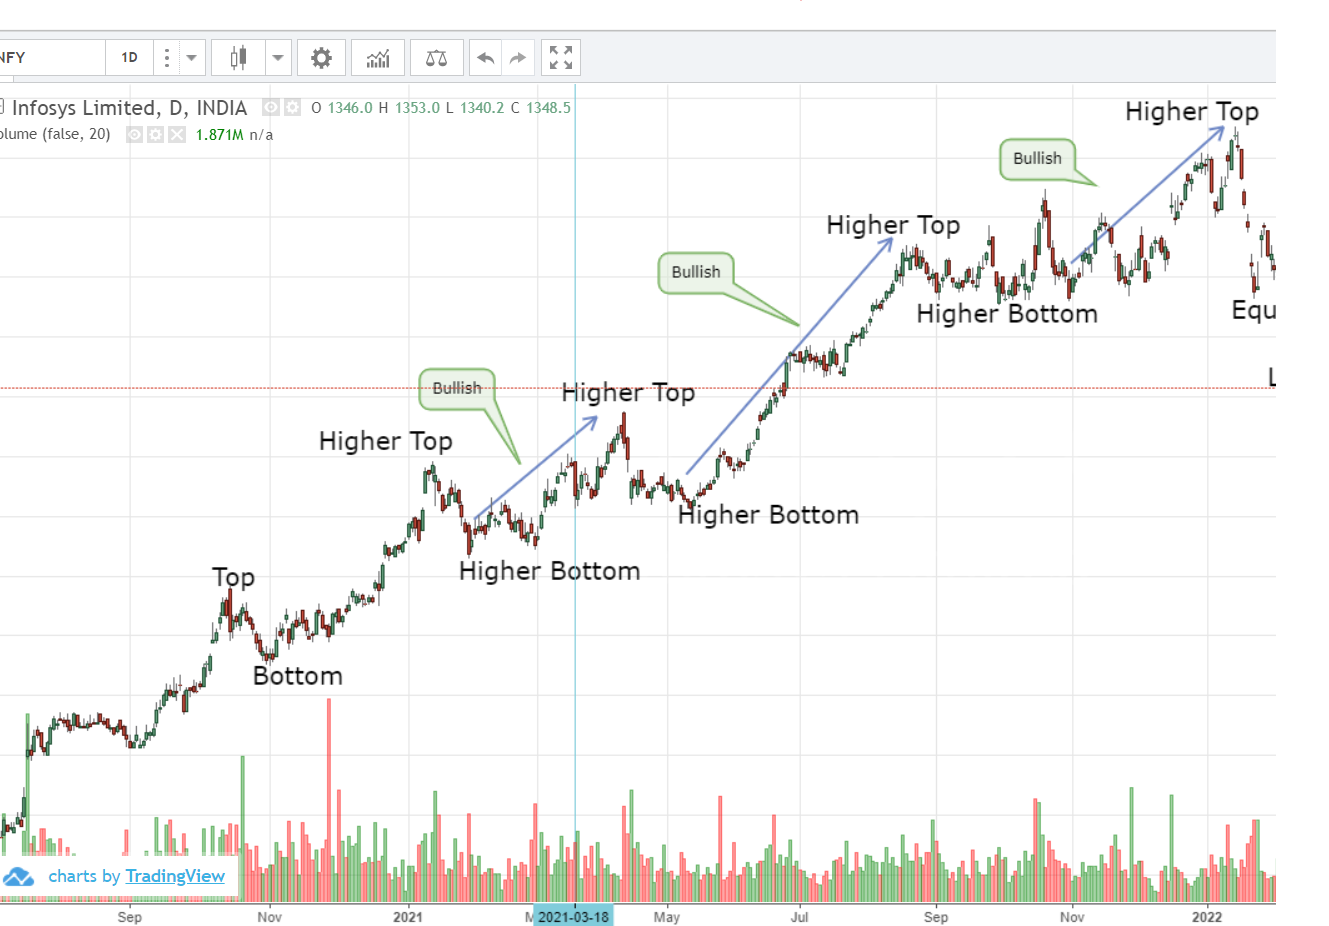
Dow Theory – Uptrend Infosys Until Nov 2022
Price Patterns summary
The price patterns explains the demand and supply and also the nature and characteristic of the market with the...
Candlestick analysis – an introduction
Candlestick analysis usually helps in weekly trading. Engulfing pattern, Doji pattern, piercing pattern, hanging man and hammer pattern are...
Stock Market Role in India
stock market is a place where it connects buyers and sellers to enable effective and efficient trading. stock market...
Price patterns – an analysis
Double top, double bottom, head and shoulder, cup pattern, flag and triangle are the various price patterns used in...
Dow Theory analysis
Down Theory is one of the important concept in technical analysis to understand the market trend of a stock...
Dow theory – an introduction
This section involves Dow theory. This was invented by Charles Dow. This helps in identifying bulling and bearish pattern...
An insight into stock analysis
Stock analysis usually consists of fundamental and technical analysis. Fundamental analysis is done for long term investing and technical...
Recently Active Members
Bullish View


Bearish View
-
 Bearish-GAP-SHORT-BICON-25-10-2019 October 25, 2019
-
 FEDERAL BANK – BEARISH ENGULFING October 17, 2019
-
 Cummins India – Bearish Engulfing – 24Sep19 September 25, 2019
-
 Day29-Tata Motors DVR – Bearish Piercing – 12Sep19 September 12, 2019
-
 Day27-Bearish-Engulfing pattern-Tech Mahindtra-09Sep19 September 10, 2019