
Intraday analysis is to analyse the market situation and price movement to make profit for buying and selling the...
Dow theory- Demand and supply.
Dow theory- supply zone- S > D = BEARISH = SELL. demand zone- D > S = BULLISH= BUY.
stock-fundamental and technical analysis
fundamental and technical analysis- pros and cons; candlestick chart.
Technical indicators
A technical indicator is a mathematical pattern derived from historical data used by technical traders or investors to predict...
GAPS and different types of GAP
GAP represents an area where no trading takes place.In an upward trend, a gap is produced when the highest...
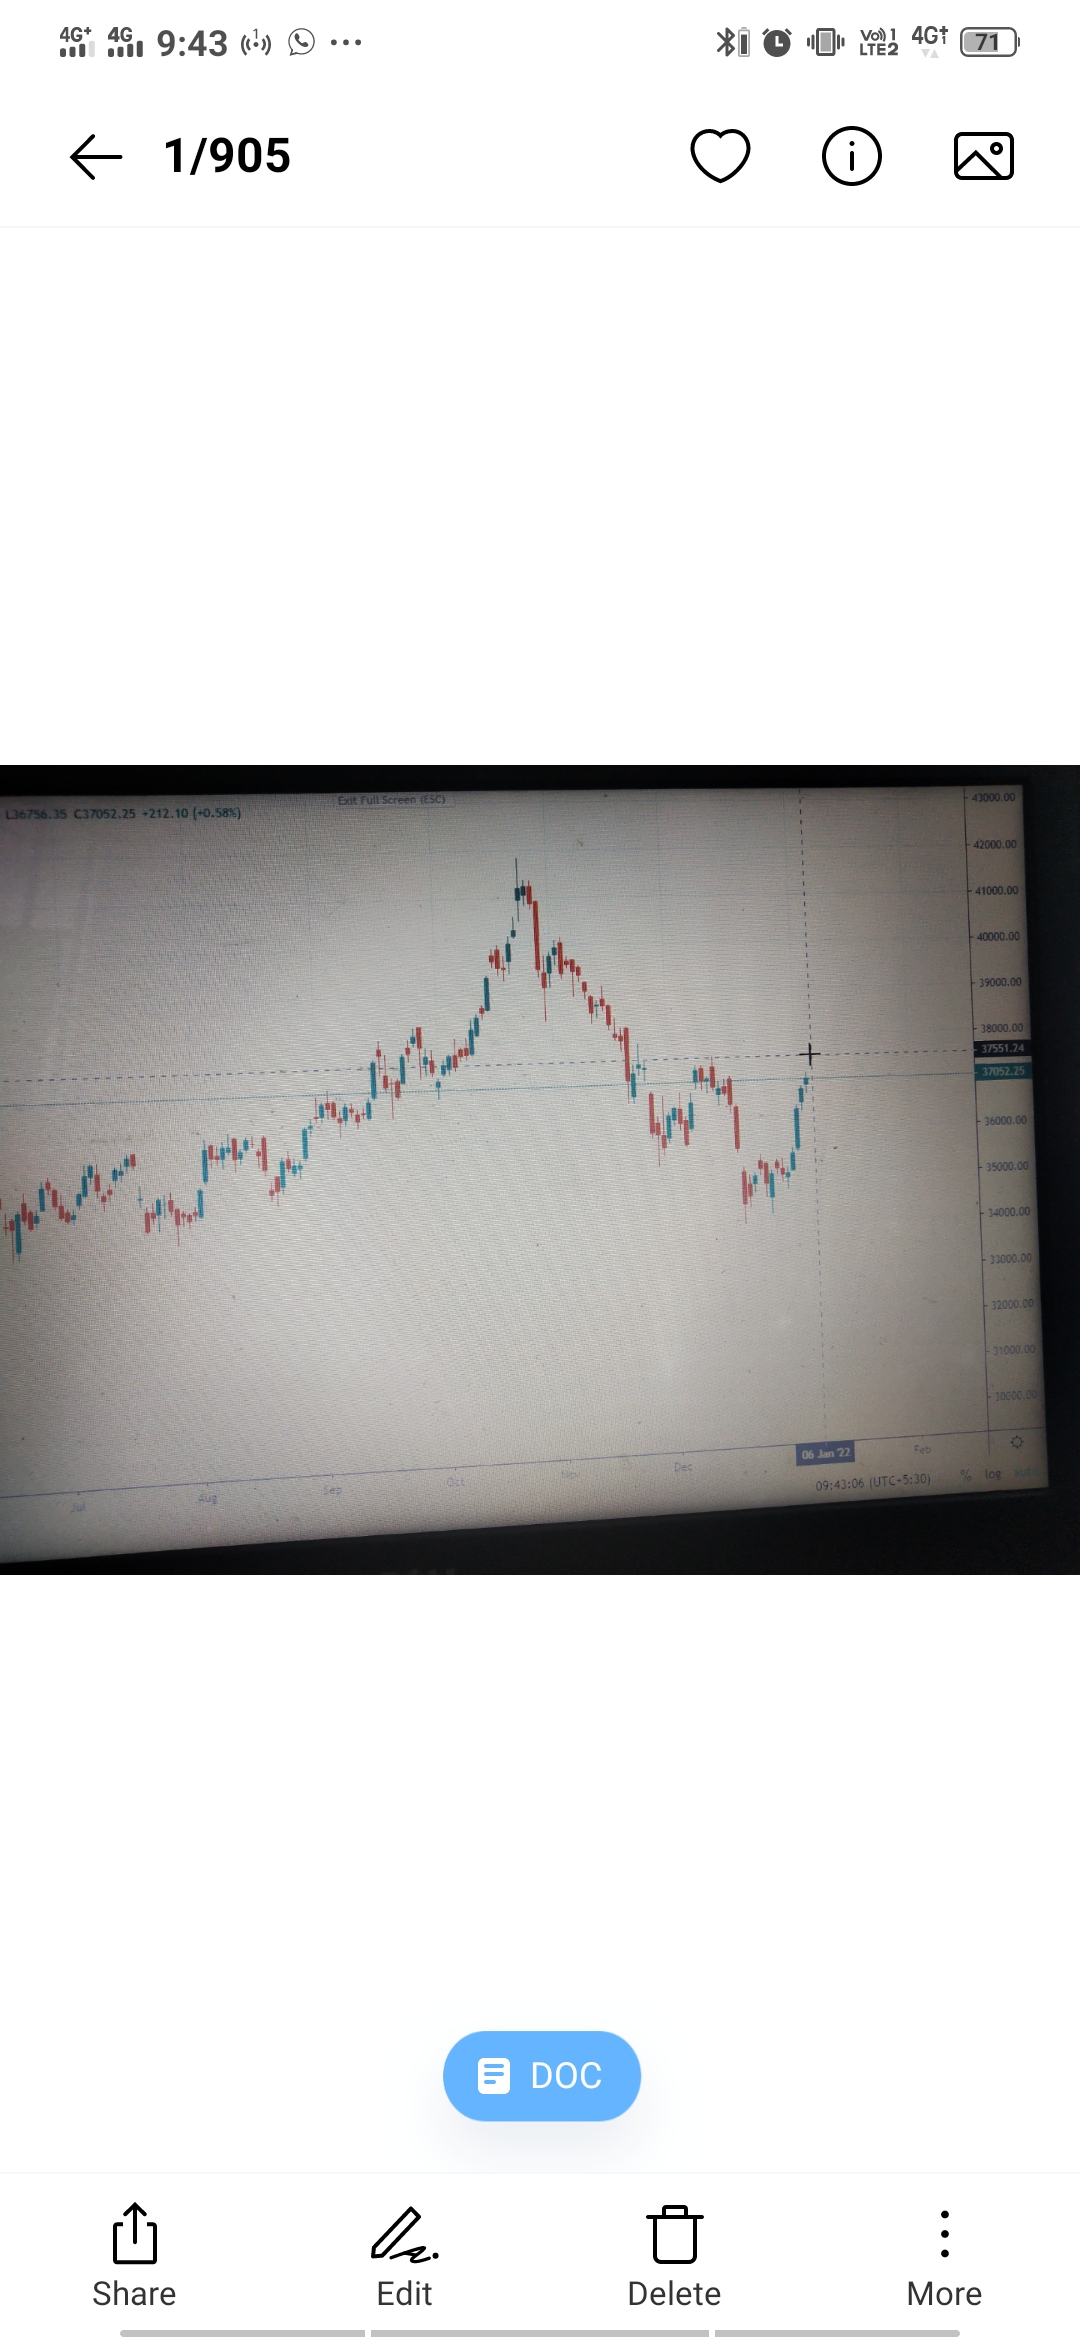
Nifty bank gots dominating market every jan feb month… Now market opens at positive mind —————————————————————————————– Stock Ticker –...
derivative trading- futures and option.
future and option trading -derivatives- expiry date in future. future-MTM- right to buy -buyer; right to sell- seller; option-...
candlestick analysis and different type of pattern
candlestick analysis deals with the Price movements and Demand & Supply. It will help us to make a stand...
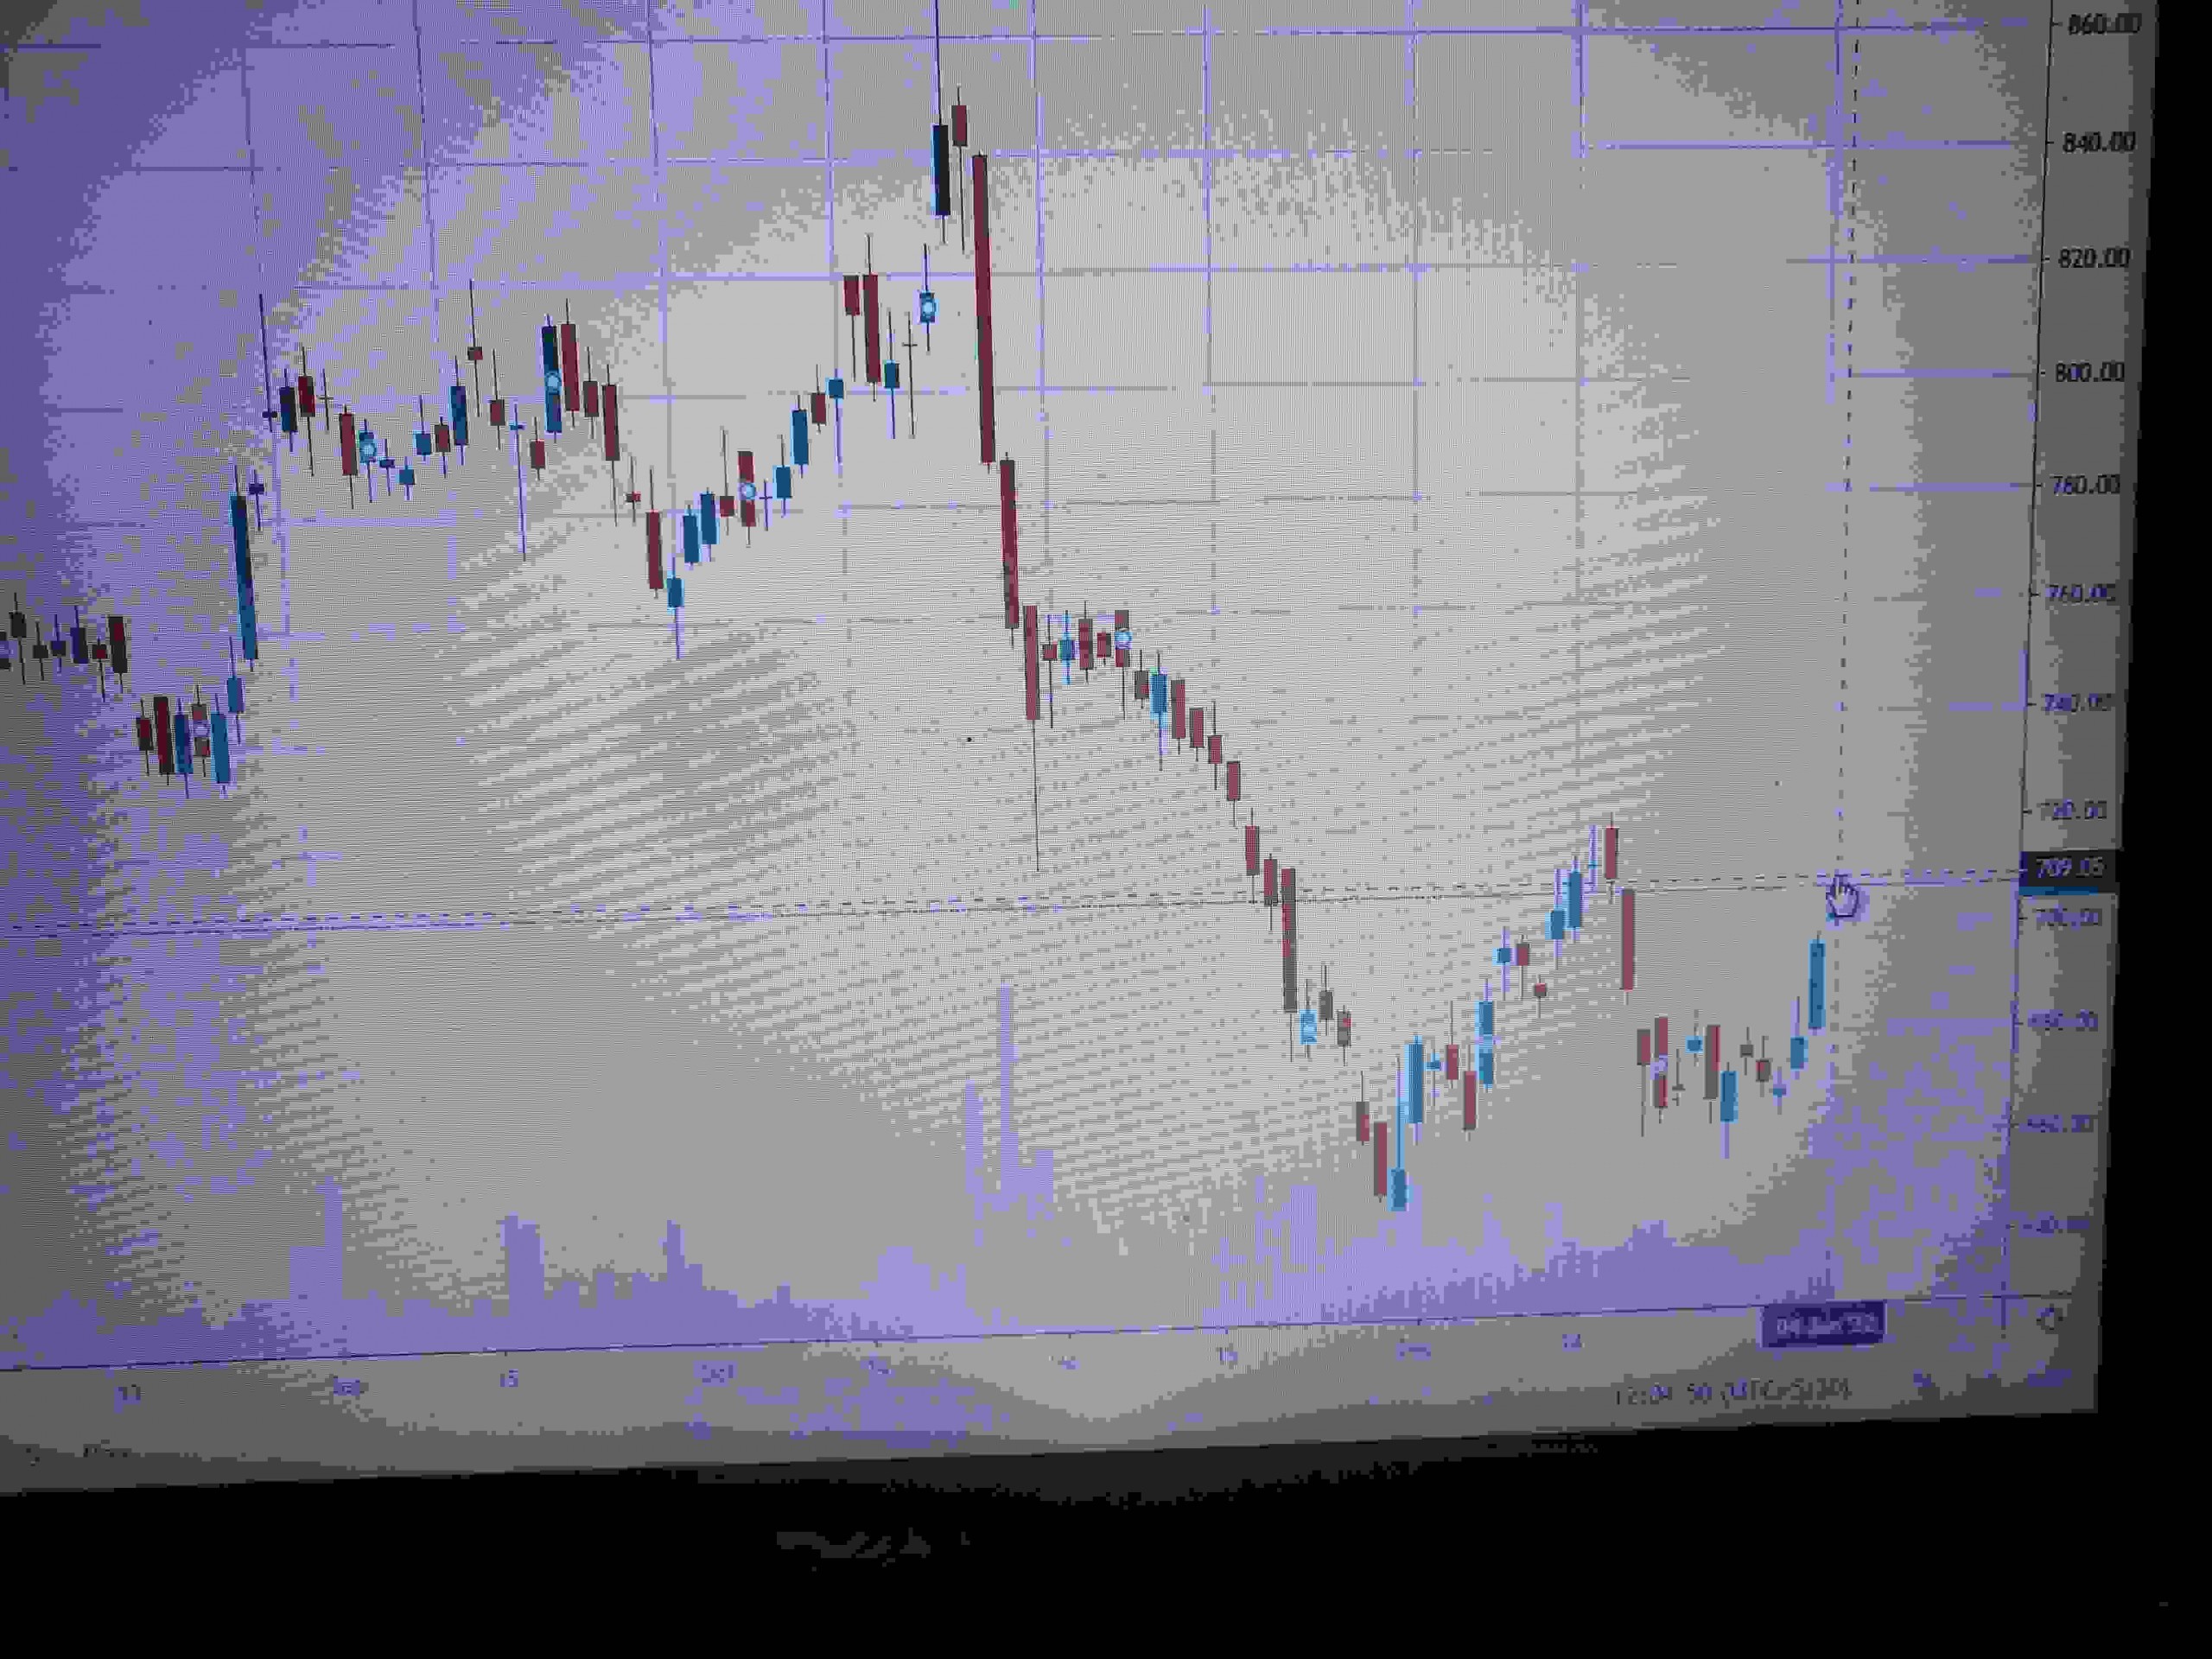
Buyer came at 667 …if its cross over 722 its become a bullish—————————————————————————————– Stock Ticker – NSE: AXISBANK –...
price pattern(flag double top,bottom and triangle,head and shoulder)
Price pattern are used to identify the movement for market using trendlines or curves it is same as double...
Recently Active Members
Bullish View


Bearish View
-
 Bearish-GAP-SHORT-BICON-25-10-2019 October 25, 2019
-
 FEDERAL BANK – BEARISH ENGULFING October 17, 2019
-
 Cummins India – Bearish Engulfing – 24Sep19 September 25, 2019
-
 Day29-Tata Motors DVR – Bearish Piercing – 12Sep19 September 12, 2019
-
 Day27-Bearish-Engulfing pattern-Tech Mahindtra-09Sep19 September 10, 2019