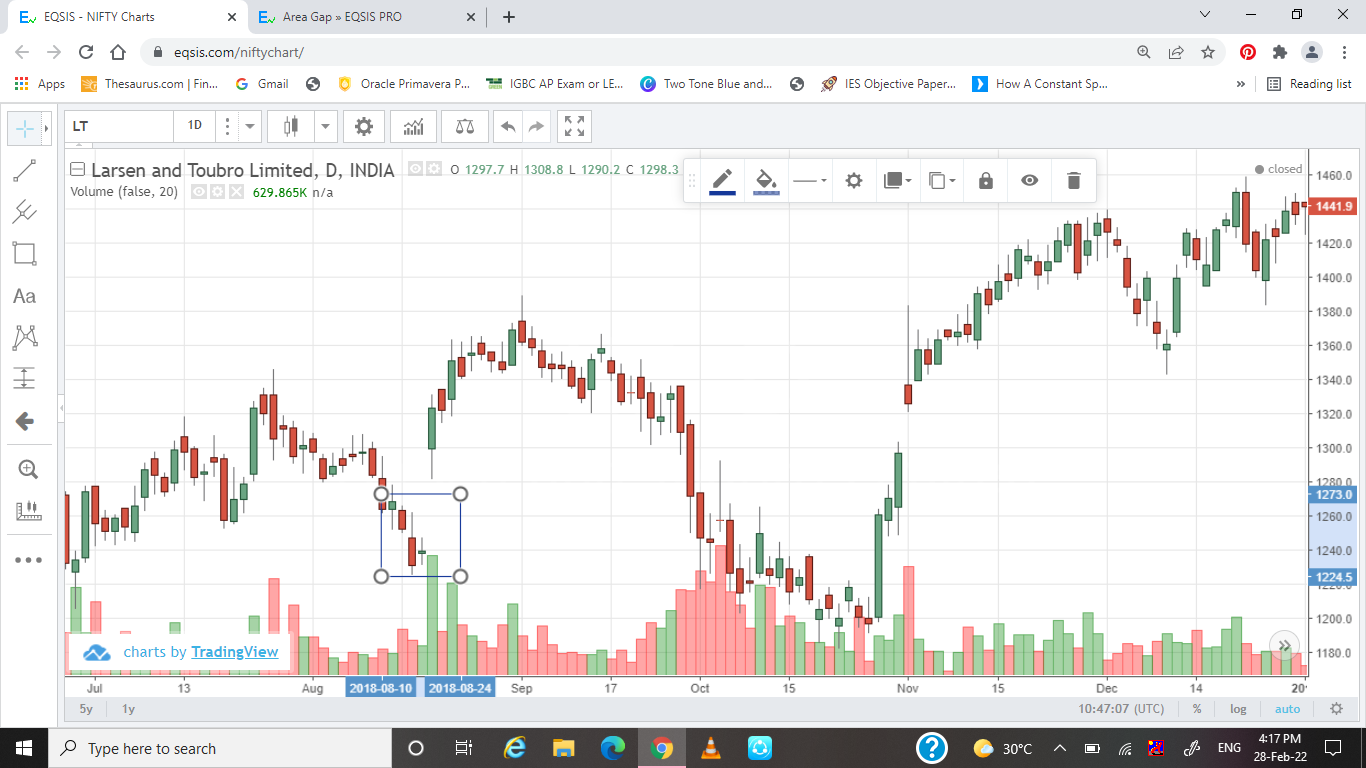
LT- Area Gap
The area gap was noticed within the trading range with low volume and the area was being filled later.
The area gap was noticed within the trading range with low volume and the area was being filled later.
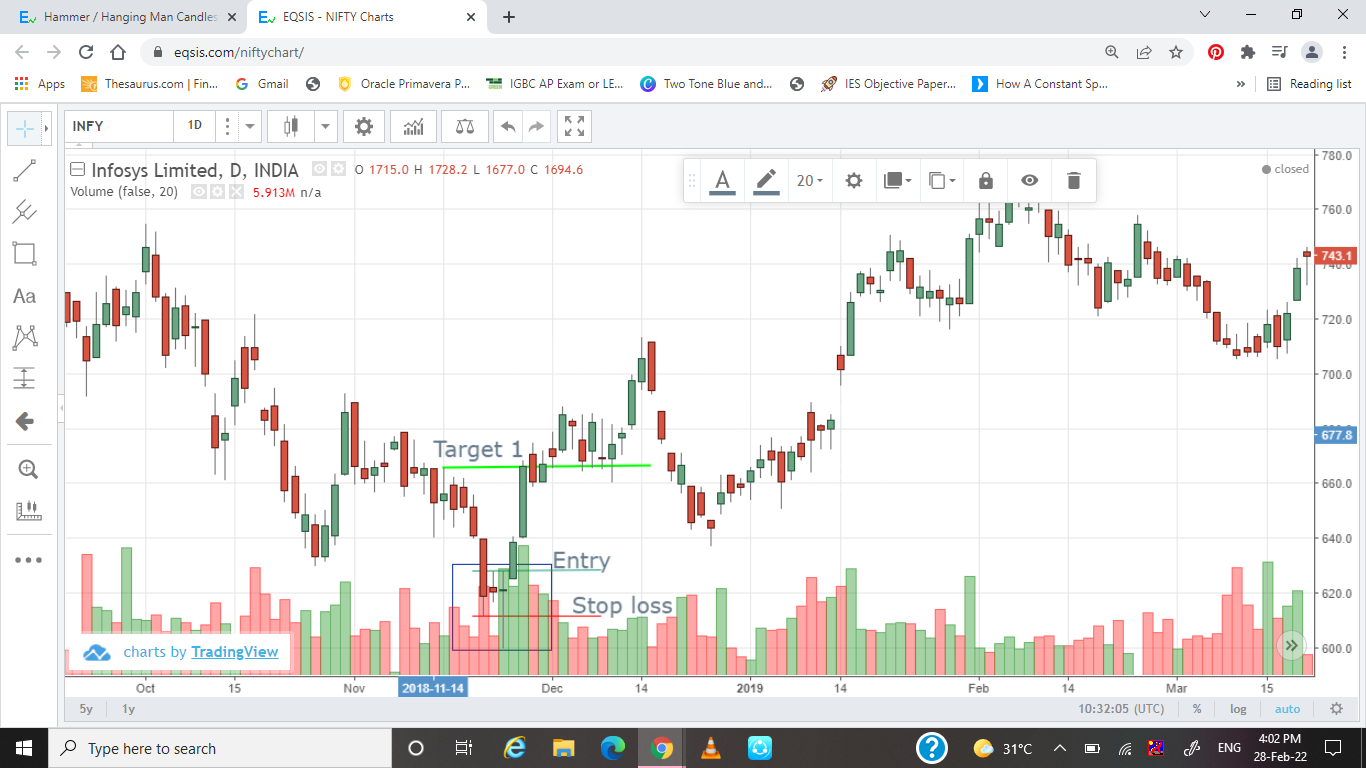
A Hammer pattern was witnessed in infosys with relatively high volume having lower tail with almost double of its...
Technical indicator is used to identify the trend, it acts as supporting tools. It can’t be used to identify...
Candlestick charts provide visual insight to current market psychology. A candlestick displays the open, high, low and closing prices....
GAP in technical analysis, Four Types of GAP, – Area Gap. – Breakout Gap. – Runaway Gap. – Exhaustion...
Candle stick analysis, Bullish/ Bearish Engulfing, Bullish/ Bearish Piercing, Doji-Morning star/Evening star, Hammer/Hanging man.
Price Patterns gives the Characteristics behind Price Movements.There are Different types of patterns available. Dow Theory, Double Top Double...
Dow Theory says the trend, Demand, Supply. It help traders to understand the market better and identify price and...
Fundamental analysis and technical analysis, Demand and Supply, stocks and news, stock price, penny stock, different type of shares.
I had an opportunity to learn the structure of stock exchange and how it operate throughout the nation.
 Bearish-GAP-SHORT-BICON-25-10-2019 October 25, 2019
 FEDERAL BANK – BEARISH ENGULFING October 17, 2019
 Cummins India – Bearish Engulfing – 24Sep19 September 25, 2019
 Day29-Tata Motors DVR – Bearish Piercing – 12Sep19 September 12, 2019
 Day27-Bearish-Engulfing pattern-Tech Mahindtra-09Sep19 September 10, 2019
Stock Trading is business, the success depends not just on capital or subscribing advisory services or participating workshops. The factors such as your awareness level about business, Efforts and your contributions, Smartness, Knowledge in analysis and trading instrument, availability of infrastructure and emotional control determine your success.
EQSIS, A Stock Market Research Firm
Knowledge is Power. Here you may start from basics, get support while practicing and evolve as active analyst, later you can become a pro