
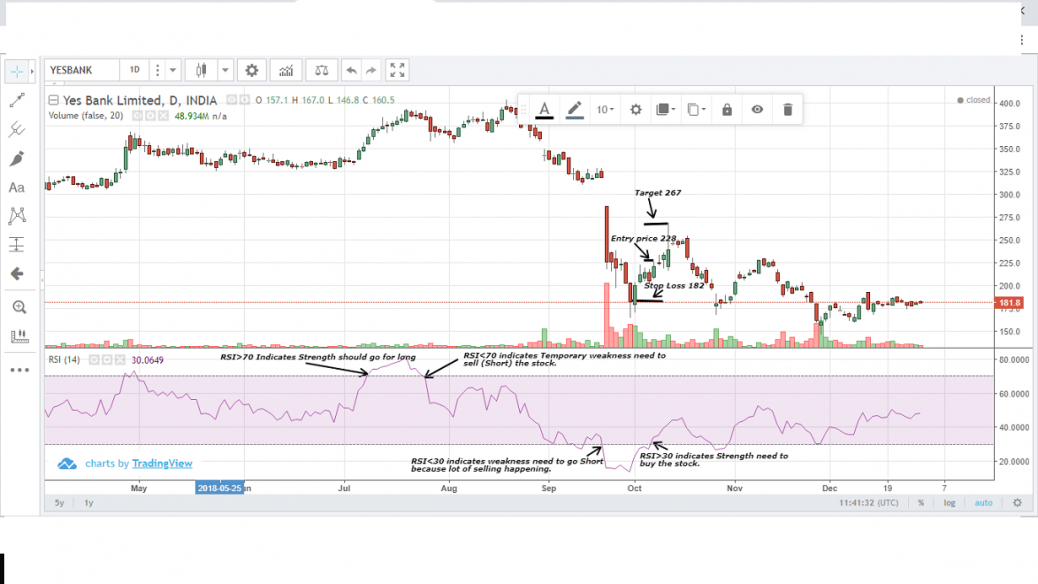
Relative Strength Index is a non trending indicator. In this chart (Refer the chart)
RSI>70 Indicates lot of people are buying the stock and it indicates lot of Strength should go for long.
RSI<70 indicates the characteristics of over bought Temporary weakness need to sell (Short).
RSI<30 indicates lot of weakness/Selling happening need to go Short because lot of selling happening.
RSI>30 indicates already it is oversold and temporary movement on upside is expected so need to buy the stock.


Hi,
Bullish Signal
When the RSI falls below 30 it simply indicates the weakness of the stock but do not indicate an oversold scenario. When the stock rises back above the 30 level after a plunge then the stock is considered to be oversold and might be due for the bullish rally.
Bearish Signal
When the RSI rises above 70 it simply indicates the strength of the stock but do not indicate an overbought scenario. When the stock fell below the 70 level after a rise then the stock is considered to be overbought and might be due for the bearish rally.
For more information click the below link
https://www.youtube.com/watch?time_continue=271&v=51yirYtyIDU
This one is wrong-RSI>70 Indicates lot of people are buying the stock and it indicates lot of Strength should go for long. RSI<30 indicates lot of weakness/Selling happening need to go Short because lot of selling happening.
Naresh: Thanks for your comment. Its good to learn from your comments.