
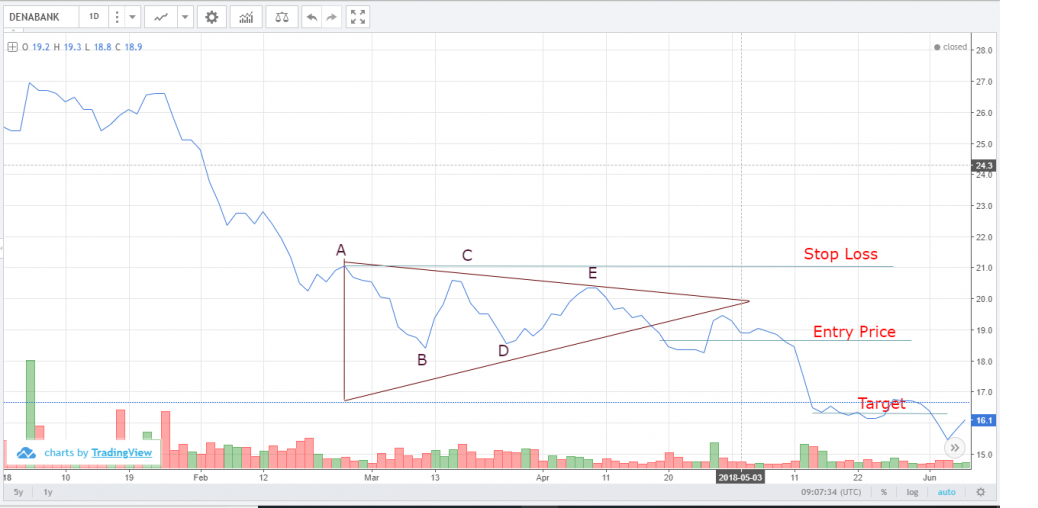
The analysis shown above reflects the triangle pattern during the period from March 2018 to May 2018 with the breakout happening on the negative side, which means the trader has to take a short position and cover his position later in the market at the appropriate target price and ensuring an equal stop loss.
The factors which have to be taken into consideration for concluding that there is a triangle pattern are :
1. There has to be a 5 wave corrective pattern (A,B,C,D,E) should form a triangle shaped structure.
2. The triangle area should be minimum 1.5 months.
3. Triangle breakout is expected around 70% zone.
4. The volume at the breakout area is expected to be good.
Therefore, the formation has to happen in line with the above mentioned principles. It can be observed from the above chart that the triangle shaped pattern has been formed with a bearish/negative breakout supported by a good volume of stock traded. Hence the trader is advised to take a short position soon after the breakout, and needs to set a target price at the lowest point in the triangle area. Since the risk taken is equal to the rewards, the appropriate target price is determined.


Hi S. Ashwin,
Good work.Clear presentation.
Valerian
Thank You