
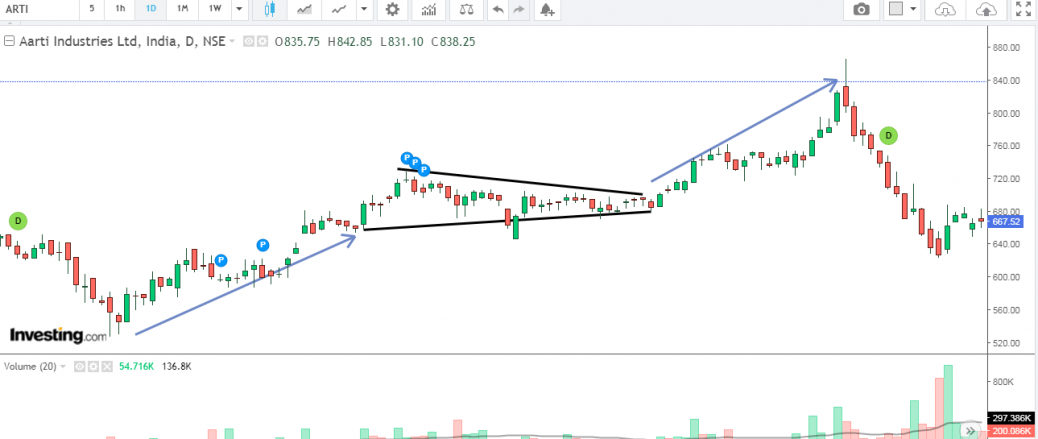
A triangle is a chart pattern, depicted by drawing trendlines along a converging price range, that connotes a pause in the prevailing trend.Triangles are similar to wedges and pennants and can be either a continuation pattern, if validated, or a powerful reversal pattern, in the event of failure.There are three potential triangle variations that can develop as price action carves out a holding pattern, namely ascending, descending, and symmetrical triangles. In Bullish triangle breakout the price breaches the upper horizontal trendline with rising volume. The upper trendline must be horizontal, indicating nearly identical highs, which form a resistance level. The lower trendline is rising diagonally, indicating higher lows as buyers patiently step up their bids. Eventually, the buyers lose patience and rush into the security above the resistance price, which triggers more buying as the uptrend resumes. The upper trendline, which was formerly a resistance level, now becomes support. The chart of Aarti industries is attached. Between Nov 2018 and jan 2019 the price moved in a triangle pattern and the with high volumes it breakout and made a high


Hi sir,
There is no witness for five-wave triangle pattern.