
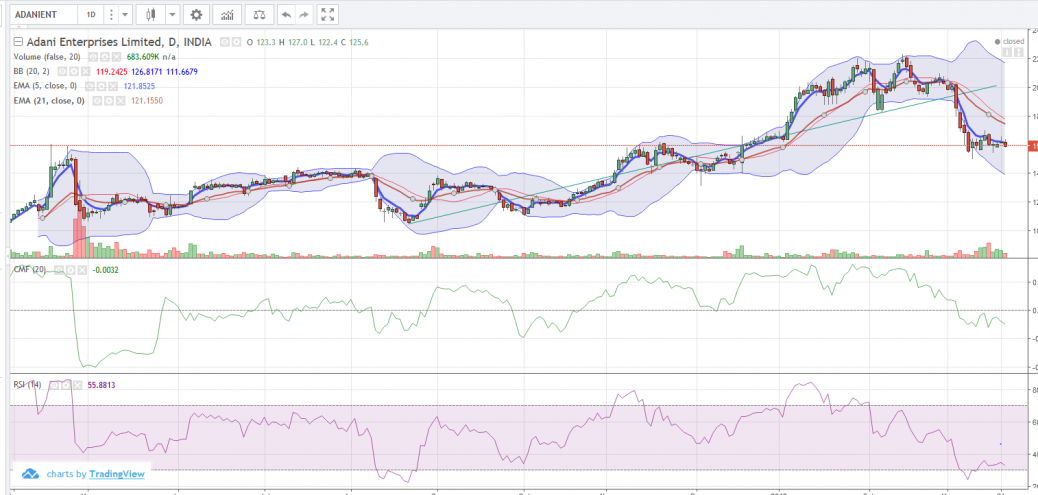
Currently the stock is trading below its 5 Day EMA . Both Price & 5 Day EMA is below 21 day EMA. The expansion in Bollinger Band suggests high Volatility .
The stock touched its lower band , but didn’t break and is near to its 5 day EMA. View :- Bearish
Currently it is trading in range .
RSI was in over sold region and currently it is showing signs of recovery
MFI is below -.05 meaning bearish
Buy:- If there is break on 5 Day EMA with high volumes and if RSI is above 50 then Good sign to Buy .
Sell:- If the Lower Bollinger Band is broken on high volumes and area is broken on the lower side


