
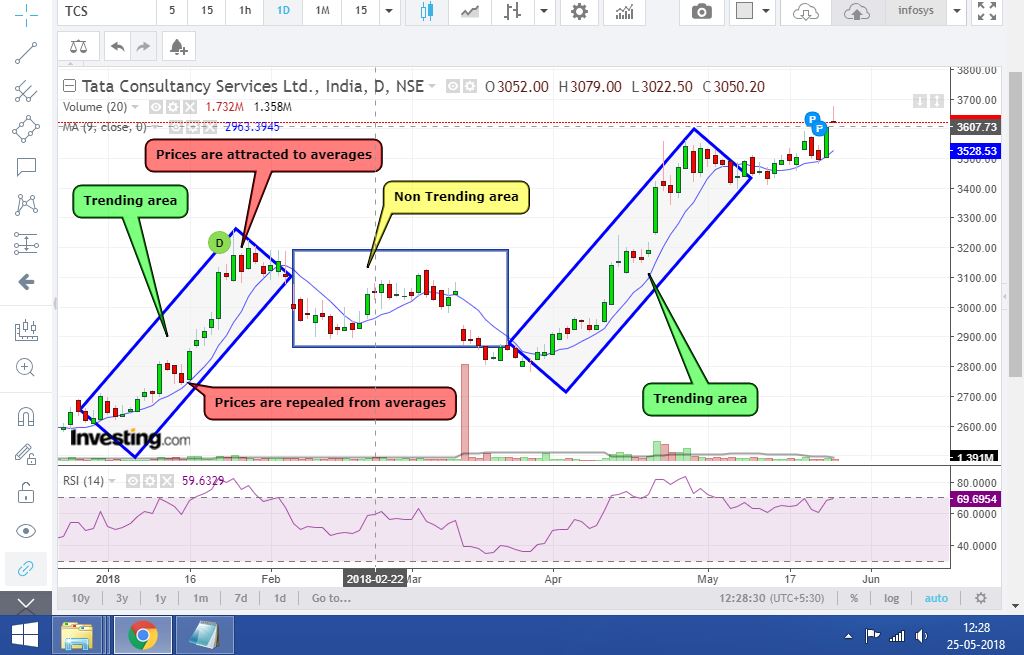
 See in the screen shot. When ever the prices moves above the moving average then that trend is considered as bullish trend and when ever the prices moves below the moving average then that trend is considered as bearish trend. But this concept wont work in the sideways direction. When ever price moves above or below the moving average then it attracts to averages and again the prices repealed from averages based on the trend strength. While using moving average with RSI we get more closer conclusion about the strength of the current trend.


