
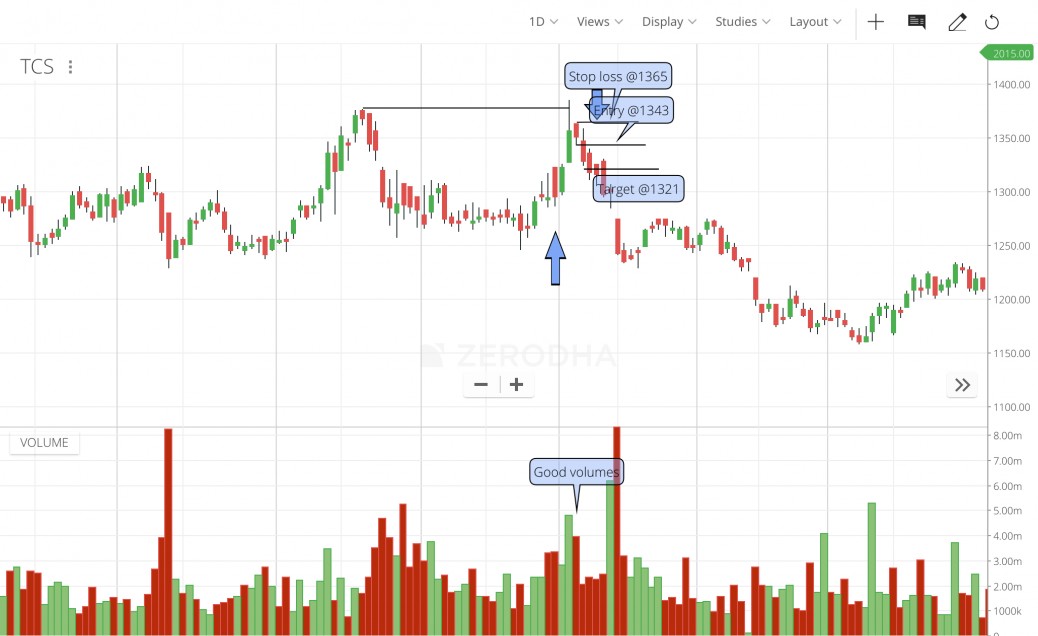
A progressive rally seen in TCS halting at a previous level of 1370. A corresponding red candle next day with good volumes indicates possibility of double top. Sell trade executed with equal risk amd reward kept in mind.
feel free to call us +919500077790 info@eqsis.com
A progressive rally seen in TCS halting at a previous level of 1370. A corresponding red candle next day with good volumes indicates possibility of double top. Sell trade executed with equal risk amd reward kept in mind.
| M | T | W | T | F | S | S |
|---|---|---|---|---|---|---|
| 1 | 2 | 3 | 4 | 5 | ||
| 6 | 7 | 8 | 9 | 10 | 11 | 12 |
| 13 | 14 | 15 | 16 | 17 | 18 | 19 |
| 20 | 21 | 22 | 23 | 24 | 25 | 26 |
| 27 | 28 | 29 | 30 | 31 | ||
 Bearish-GAP-SHORT-BICON-25-10-2019 October 25, 2019
 FEDERAL BANK – BEARISH ENGULFING October 17, 2019
 Cummins India – Bearish Engulfing – 24Sep19 September 25, 2019
 Day29-Tata Motors DVR – Bearish Piercing – 12Sep19 September 12, 2019
 Day27-Bearish-Engulfing pattern-Tech Mahindtra-09Sep19 September 10, 2019
Stock Trading is business, the success depends not just on capital or subscribing advisory services or participating workshops. The factors such as your awareness level about business, Efforts and your contributions, Smartness, Knowledge in analysis and trading instrument, availability of infrastructure and emotional control determine your success.
EQSIS, A Stock Market Research Firm
Knowledge is Power. Here you may start from basics, get support while practicing and evolve as active analyst, later you can become a pro


Hi,
This is not an exact double bottom because the prior trend is side ways movement while your trading setup is totally differ. click the below link for more information about double top.
https://www.youtube.com/watch?v=skN4U1xuUs8
Thank you for the feed back sir… I will rectify it.