
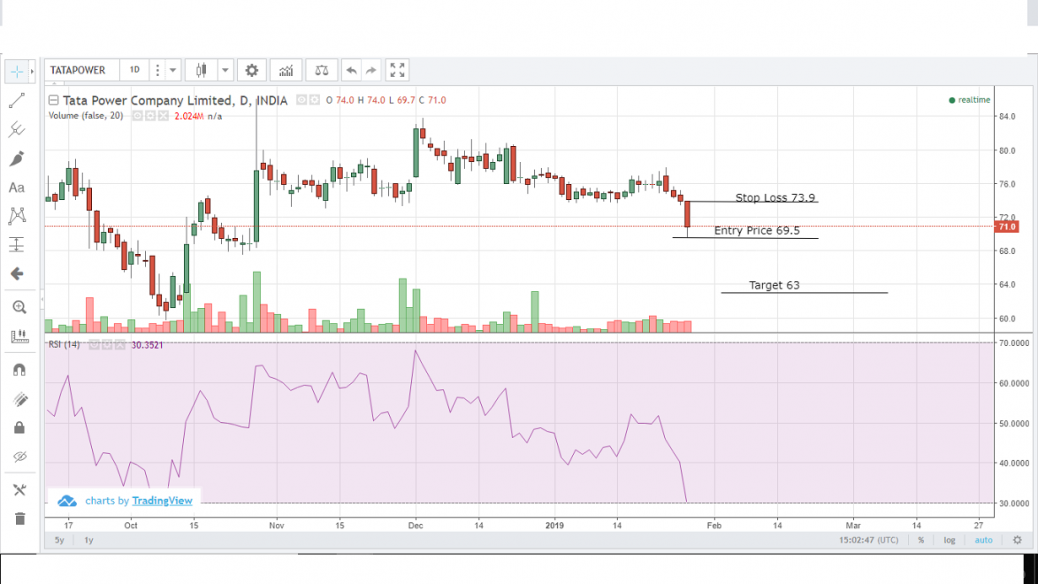
Tata Power stock can be seen breaking down the support level and also it is trading at RSI 30 level.
feel free to call us +919500077790 info@eqsis.com
Tata Power stock can be seen breaking down the support level and also it is trading at RSI 30 level.
| M | T | W | T | F | S | S |
|---|---|---|---|---|---|---|
| 1 | 2 | 3 | 4 | 5 | ||
| 6 | 7 | 8 | 9 | 10 | 11 | 12 |
| 13 | 14 | 15 | 16 | 17 | 18 | 19 |
| 20 | 21 | 22 | 23 | 24 | 25 | 26 |
| 27 | 28 | 29 | 30 | 31 | ||
 Bearish-GAP-SHORT-BICON-25-10-2019 October 25, 2019
 FEDERAL BANK – BEARISH ENGULFING October 17, 2019
 Cummins India – Bearish Engulfing – 24Sep19 September 25, 2019
 Day29-Tata Motors DVR – Bearish Piercing – 12Sep19 September 12, 2019
 Day27-Bearish-Engulfing pattern-Tech Mahindtra-09Sep19 September 10, 2019
Stock Trading is business, the success depends not just on capital or subscribing advisory services or participating workshops. The factors such as your awareness level about business, Efforts and your contributions, Smartness, Knowledge in analysis and trading instrument, availability of infrastructure and emotional control determine your success.
EQSIS, A Stock Market Research Firm
Knowledge is Power. Here you may start from basics, get support while practicing and evolve as active analyst, later you can become a pro


Hi,
This is not an appropriate call if you taken it as a RSI perspective. Read the below lines
Bullish Signal
When the RSI falls below 30 it simply indicates the weakness of the stock but do not indicate an oversold scenario. When the stock rises back above the 30 level after a plunge then the stock is considered to be oversold and might be due for the bullish rally.
Bearish Signal
When the RSI rises above 70 it simply indicates the strength of the stock but do not indicate an overbought scenario. When the stock fell below the 70 level after a rise then the stock is considered to be overbought and might be due for the bearish rally.