
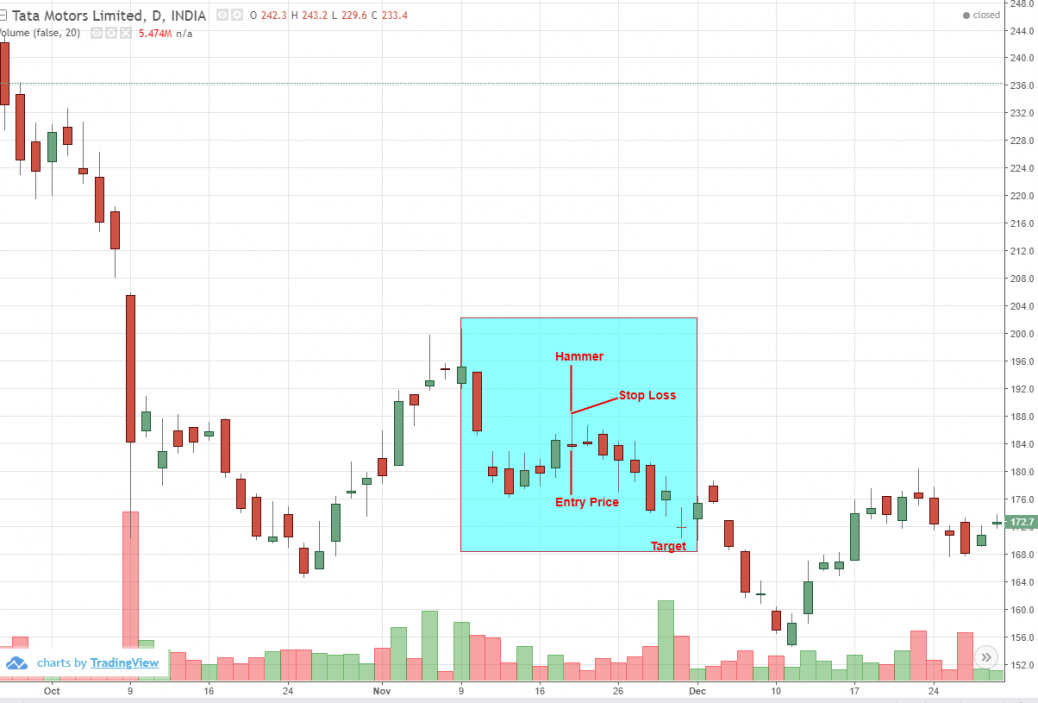
Tata Motors Ltd. formed a bearish hammer after price rise. So it is likely to go down and the details are discussed here below.
feel free to call us +919500077790 info@eqsis.com
Tata Motors Ltd. formed a bearish hammer after price rise. So it is likely to go down and the details are discussed here below.
| M | T | W | T | F | S | S |
|---|---|---|---|---|---|---|
| 1 | 2 | 3 | 4 | 5 | 6 | 7 |
| 8 | 9 | 10 | 11 | 12 | 13 | 14 |
| 15 | 16 | 17 | 18 | 19 | 20 | 21 |
| 22 | 23 | 24 | 25 | 26 | 27 | 28 |
| 29 | 30 | |||||
 Bearish-GAP-SHORT-BICON-25-10-2019 October 25, 2019
 FEDERAL BANK – BEARISH ENGULFING October 17, 2019
 Cummins India – Bearish Engulfing – 24Sep19 September 25, 2019
 Day29-Tata Motors DVR – Bearish Piercing – 12Sep19 September 12, 2019
 Day27-Bearish-Engulfing pattern-Tech Mahindtra-09Sep19 September 10, 2019
Stock Trading is business, the success depends not just on capital or subscribing advisory services or participating workshops. The factors such as your awareness level about business, Efforts and your contributions, Smartness, Knowledge in analysis and trading instrument, availability of infrastructure and emotional control determine your success.
EQSIS, A Stock Market Research Firm
Knowledge is Power. Here you may start from basics, get support while practicing and evolve as active analyst, later you can become a pro


Hi,
Hammer appear at the end of a downtrend and also at the end of a correction and volume should be high during the hammer day.
Hammer man candlestick express the reversal pattern because it has a characteristic that the day of hammer man pattern in which the sellers were initially in charge but yet the buyers were capable to reverse that control and drive prices back up to close near the high for the day, as a form that the short body at the top of the candle.