
@vignesh
-

Ajai Kamath and
Vignesh are now friends 6 years, 10 months ago
-

Vinish Kumar and
-
Vignesh and
bhavani are now friends 8 years ago
-
Vignesh posted an update 8 years ago
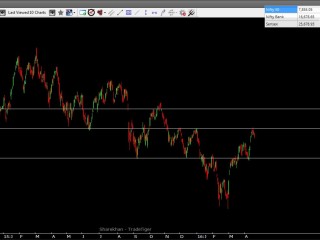
Whenever nifty touches 7970 its pulled back 400 points in the history………hope this time will also happen same..if the nifty close above 7970 in daily time frame then my target is 8250…let see
-
Vignesh and
Vignesh are now friends 8 years ago
-

logawin and
-
NARENTHIRAN and
-
Vignesh replied to the topic What is the logic behind golden Mean – Fibonacci Series? in the forum Technical Indicators to understand market trend 8 years, 4 months ago
Adding two consecutive number forms Fibonacci Series.Dividing one with successive number will give us Golden Mean.
-
Vignesh replied to the topic How do we use Fibonacci retracement to identify support and resistance zone? in the forum Technical Indicators to understand market trend 8 years, 4 months ago
Fibonacci retracement uses horizontal lines to indicate support and resistance. These are created by drawing the trend line and dividing them by fibonacci ratios.
-
Vignesh replied to the topic What is RSI? How to identify the buying zone? in the forum Technical Indicators to understand market trend 8 years, 4 months ago
A technical momentum indicator that compares the magnitude of recent gains to recent losses in an attempt to determine overbought and oversold conditions of an asset. It is calculated using the following formula:
RSI = 100 – 100/(1 + RS*)
*Where RS = Average of x days’ up closes / Average of x days’ down closes.
RSI ranges form…[Read more]
-
Vignesh replied to the topic What is Moving Average? in the forum Technical Indicators to understand market trend 8 years, 4 months ago
Moving average is mathematical value of the historical movement of stock. It depends on the Technical Analyst to consider the no of days that should take in account. Mostly fundamentally stock companies will trade above simple moving average.
We can not predict anything using this value, because if at all bad companies trades below moving…[Read more]
-
Vignesh replied to the topic What is called technical indicators? How it is different from other analysis? in the forum Technical Indicators to understand market trend 8 years, 4 months ago
Technical indicators are tool which available ready to use to confirm whether the technical analysis result matches or not.
When we do TA, we may need some indicators and witnesses to identify the trend.
-
Vignesh replied to the topic What are the characteristics of four phases (Consolidation, Breakout, Runaway and Exhaustion) of trend? in the forum GAP Analysis and its interpretations 8 years, 4 months ago
Consolidation GAP: Area gap : The gap which appears in non-trending area with the low volume. Mostly this gap will be filled in short span.
Breakout: The gap that appears in trending area with high volume and should not be filled. It shows the buyer strength. So it indicates further move.
Runway: The gap that appears after breakout and in…[Read more]
-
Vignesh replied to the topic What do we interpret using GAP ANALYSIS? in the forum GAP Analysis and its interpretations 8 years, 4 months ago
Strength of the market and trend.
-
Vignesh replied to the topic How to name a GAP? What are Four Types of GAP? in the forum GAP Analysis and its interpretations 8 years, 4 months ago
Gap can be named by the place where it creating a space. Its shows the strength and weakness.
Area Gap
Breakout Gap
Runaway Gap
Exhaustion Gap
-
Vignesh replied to the topic What is called as GAP in technical analysis? in the forum GAP Analysis and its interpretations 8 years, 4 months ago
In candle chart with daily interval, the significance space can be found between two candle whether trendy or non trendy. This called GAP. Its very much useful to analyst to figure out the clear picture of the trend.
-
Vignesh replied to the topic What are HAMMER / hanging man? Why it is very popular when to buy and Sell? in the forum The Simple Candlestick Analysis 8 years, 4 months ago
Hammer actually forms in gap down day. Hammer day the lower tail should be greater than the body 2 times and higher must be very low. There is no need of range the close with the comparison of previous day.
Hammer must be green in color and volume must be high at hammer day.
This hammer shows there is no major selling . Hence it indicates…[Read more]
-
Vignesh replied to the topic What is morning and evening STAR? When to buy and Sell? in the forum The Simple Candlestick Analysis 8 years, 4 months ago
Morning star in American format like after night, day comes wise if doji comes after a significant fall then its morning star. we can buy while cross doji high.
Evening star is shows bearish trend.
-
Vignesh replied to the topic What is DOJI? How to make use of DOJI? in the forum The Simple Candlestick Analysis 8 years, 4 months ago
Doji is nothing. Open and close at same level but higher volume should be there. It looks like a star. Doji must be identified after significant rally. It shows the weakness of prior zoner, so it may show some reversal.
Powerful trend reversal pattern is Doji.
-
Vignesh replied to the topic What is piercing pattern? What are its conditions to qualify? When to buy and Sell? in the forum The Simple Candlestick Analysis 8 years, 4 months ago
Its trend reversal pattern.
Prior rally must. today body must cover previous day low and the closing should be above 50% of previous body. Upper tail must not be big.
Long must be created after crossing previous day high.
- Load More
 Capture