
@karthikb
-

srinivash c g and
 karthik Balasubramanian are now friends 7 years, 2 months ago
 -
Udayarka Pakala and
karthik Balasubramanian are now friends 7 years, 2 months ago -
Swaminathan and
karthik Balasubramanian are now friends 7 years, 9 months ago -
karthik Balasubramanian posted an update 7 years, 9 months ago
Continuation of bearish engulfing pattern from 13-072016 due to weak quarter results.If it breaks the low of 15-07-2016 which is 1052 then it can go down further.Short can be initiated with a stoploss of 1189 which is high on 15-07-2016
-
karthik Balasubramanian posted an update 8 years ago
Reliance Industries has bought crude oil from Iran after a 6-year break.
-

Vinish Kumar and
karthik Balasubramanian are now friends 8 years ago -
karthik Balasubramanian posted an update 8 years ago
Doji formed in Tata Steel weekly chart.There is a news on Tata steel selling its stake to ThyssenKrupp.
-
karthik Balasubramanian posted an update 8 years ago
Double top formation of HDFC
-
karthik Balasubramanian posted an update 8 years, 1 month ago
Bearish engulfing formation in Maruti Daily Chart on 17 -03- 2016
-
karthik Balasubramanian replied to the topic What is Engulfing pattern? What are its conditions to qualify? When to buy and Sell? in the forum The Simple Candlestick Analysis 8 years, 1 month ago
Engulfing is a reversal pattern in Candlestick analysis which can be bearish or bullish.If it is formed at the end of uptrend it Bearish and Bullish if it is formed at bottom of uptrend.
conditions for Bearish Engulfing Eg:
#)uptrend in the stock previous days
#)Bullish candle formed at top and followed by bearish candle in day which…[Read more]
-

EQSIS and
karthik Balasubramanian are now friends 8 years, 1 month ago -
karthik Balasubramanian changed their profile picture 8 years, 1 month ago
-
karthik Balasubramanian replied to the topic What is RSI? How to identify the buying zone? in the forum Technical Indicators to understand market trend 8 years, 1 month ago
RSI is Relative Strength Index which shows the stock or index`s trading strength.It provides oversold and overbought levels.It works in non trending market.It measured by 2 scales 70 and 30.Buying zone is the level at which price goes below 30 mark scale and raises above 30.
-
karthik Balasubramanian replied to the topic What is the IDEAL time to trade intraday? in the forum Intraday Analysis for Day Traders 8 years, 1 month ago
10am to 11.30am and 2pm to 3pm.2 to 3 is the most active session
-
karthik Balasubramanian became a registered member 8 years, 1 month ago
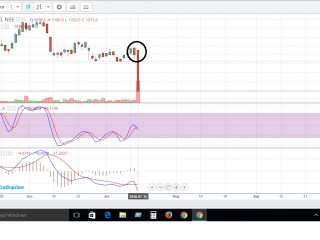 INFOSYS-Continuation of bearish engulfing
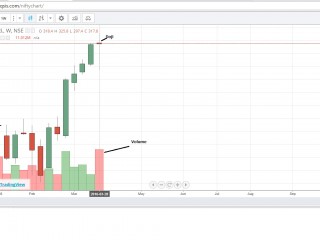 Tatasteel Doji
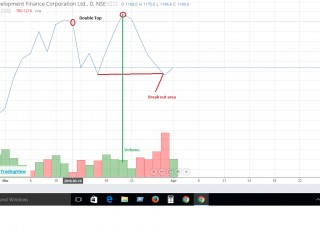 HDFC-Double top
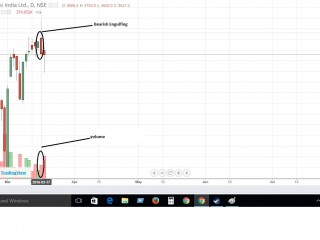 Maruti -Bearish engulfing