
@guru883
-
Guru Prasad wrote a new post, AXIS BANK 5 years, 6 months ago
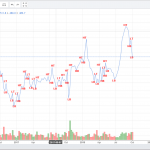
This is Axis bank chart, where i have taken 2 years data to analyse the Dow theoryChart pattern is line chart.The pattern seems to be bearish as we could see that it has made a high comparing last 2 years of
-
Guru Prasad wrote a new post, JINDALSTEEL 5 years, 7 months ago
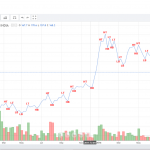
This is a Jinda steel company, where i have taken 2 years data to analyse the Dow theory.Chart pattern is line chart.Trend you could see that it made a down trend and there will be a change in trend where it may
-
Guru Prasad wrote a new post, Day 10 – Activity – Intraday 5 years, 8 months ago
Intraday analysis is useful for intraday trading, the positional analysis is useful for near-term to long-term trading.10.00-11.30 am, 2-2.45 pm4 steps
1.global market performance
2.FII activity
3.indian market -
Guru Prasad wrote a new post, Day 9 – Activity- Technical indicator 5 years, 8 months ago
Technical indicators are used most extensively by active traders in the market, as they are designed primarily for analyzing short-term price movements.
Moving average is the most basic of the moving averages -
Guru Prasad wrote a new post, Day 8 – Activity- Gap analysis 5 years, 8 months ago
Gap is the difference in trading range. It can easily identified in candlestick chart. It indicated the trend is moving with strength or lacking in strength.Four types of gap is there, 1. Area gap, 2. Breakout gap
-
Guru Prasad wrote a new post, Day 7 – Activity – Candle stick analysis 5 years, 9 months ago
This candlestick analysis helped to understand the different forms of candle stick patterns. It help us to know more about the pricing behavior and also able to predict the market movements in future.
-
Guru Prasad wrote a new post, Day 6 – Activity- Price patterns 5 years, 9 months ago
-Price patterns in technical analysis
-Double Top
-Double bottom
-Head and Shoulder
-inverted Head and Shoulder
– Flag pattern
-Cup Pattern
– Entry price, Exit Price and Stop loss for Flag Pattern -
Guru Prasad wrote a new post, Day 5 – Activity- Dow theory 5 years, 9 months ago
Dow theory is the basis of today’s age fundamental analysis. Dow predicted the major trends in market using the overall health of market environment. dow theory is still reliable even after 100 years. it can g
-
Guru Prasad wrote a new post, Day 4 – Activity- Basis of stock analysis 5 years, 9 months ago
Stock price is driven by demand and supply in the market. When there are more buyers for a stock than sellers, the price goes high and when there are more people selling a stock than the number of buyers the price
-
Guru Prasad wrote a new post, Day 3 – Activity – F & O 5 years, 9 months ago
Future & Options These are derivative instruments traded on the stock exchange. The instrument has no independent value, with the same being ‘derived’ from the value of the underlying asset. The asset could be sec
-
Guru Prasad wrote a new post, Day 2- Activity – Basis of stock trading 5 years, 9 months ago
In stock trading the buyers and sellers play a crucial role in determining the stock prices. Thus the stock prices are purely driven by the supply and demand factor. For more supply the price will go down and if
-
Guru Prasad wrote a new post, Day 1 – Activity 5 years, 9 months ago
Day 1 – Made us to think and recollect about the many terms in stock market and it also helped us in learning about the new things in stock market, we could able to learn something by doing this activity. All the
-

EQSIS and
Guru Prasad are now friends 5 years, 9 months ago
-
Guru Prasad became a registered member 5 years, 9 months ago