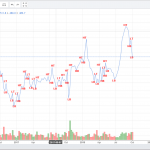
This is Axis bank chart, where i have taken 2 years data to analyse the Dow theory
Chart pattern is line chart.
The pattern seems to be bearish as we could see that it has made a high comparing last 2 years of data.
So, it will have a bearish trend in upcoming months.


