
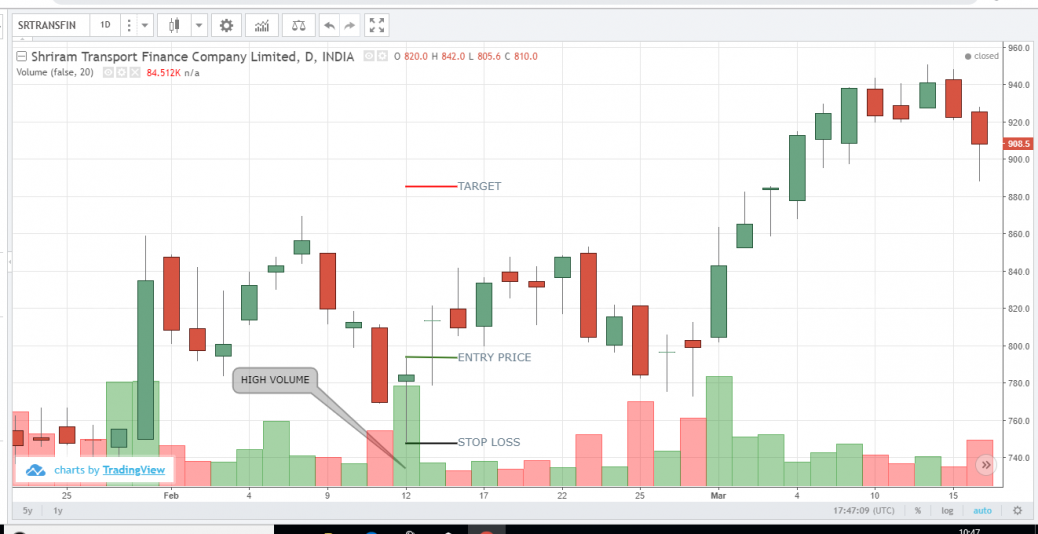
Significant price fall is present with the formation of Hammer. Volume is high which indicates the trend reversal. Long position is considered when the price crosses the Hammer day high.
feel free to call us +919500077790 info@eqsis.com
Significant price fall is present with the formation of Hammer. Volume is high which indicates the trend reversal. Long position is considered when the price crosses the Hammer day high.
| M | T | W | T | F | S | S |
|---|---|---|---|---|---|---|
| 1 | 2 | 3 | 4 | 5 | ||
| 6 | 7 | 8 | 9 | 10 | 11 | 12 |
| 13 | 14 | 15 | 16 | 17 | 18 | 19 |
| 20 | 21 | 22 | 23 | 24 | 25 | 26 |
| 27 | 28 | 29 | 30 | 31 | ||
 Bearish-GAP-SHORT-BICON-25-10-2019 October 25, 2019
 FEDERAL BANK – BEARISH ENGULFING October 17, 2019
 Cummins India – Bearish Engulfing – 24Sep19 September 25, 2019
 Day29-Tata Motors DVR – Bearish Piercing – 12Sep19 September 12, 2019
 Day27-Bearish-Engulfing pattern-Tech Mahindtra-09Sep19 September 10, 2019
Stock Trading is business, the success depends not just on capital or subscribing advisory services or participating workshops. The factors such as your awareness level about business, Efforts and your contributions, Smartness, Knowledge in analysis and trading instrument, availability of infrastructure and emotional control determine your success.
EQSIS, A Stock Market Research Firm
Knowledge is Power. Here you may start from basics, get support while practicing and evolve as active analyst, later you can become a pro


Hi,
Good try……..the prior trend for the Hammer should be a down trend.
Just for reference…. read the below Criteria for Hammer pattern:
Hammers have a small real body and a long lower tail.
The upper tail should be invisible or very small in size
Hammer should be green in colour.
Hammers occur after a price decline.
Volume should be high during hammer day.
Thanks for the correction.