
The relative strength index is calculated using the following formula:
RSI = 100 – 100 / (1 + RS) , where RS = Average gain of up periods during the specified time frame / Average loss of down periods during the specified time frame/
The RSI provides a relative evaluation of the strength of a security’s recent price performance, thus making it a momentum indicator. RSI values range from 0 to 100. The default time frame for comparing up periods to down periods is 14, as in 14 trading days.
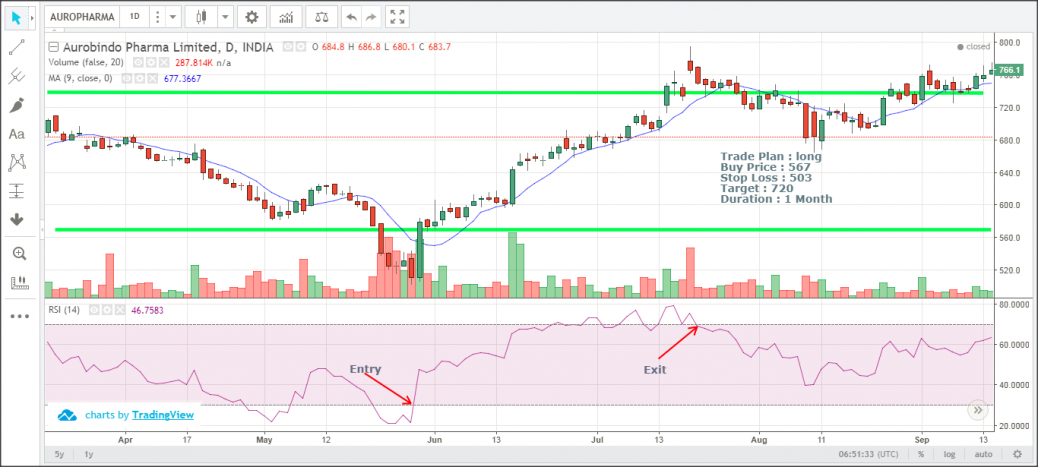
In the attached chart, a possible trade has been identified based on RSI along with Moving Average indicator. A long position is suggested when RSI indicator over sold and the exit position is based on the over bought indication.


Hi sir,
your work is good with clear explanation and markings.