
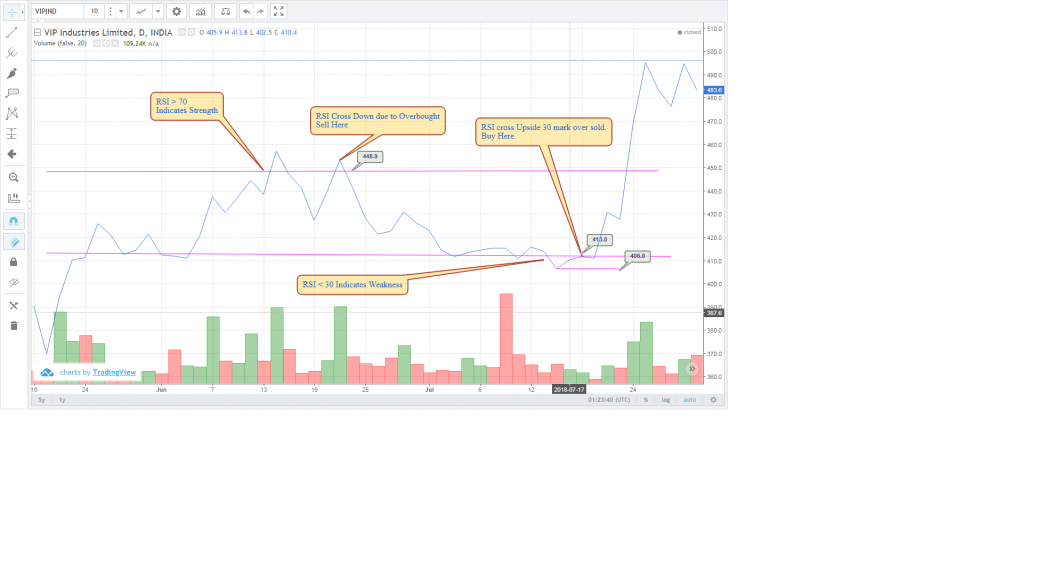
Relative Strength Index – RSI
Use 21 days Chart.
Sell when RSI cross down 70 mark Over Bought – 448.9
Buy when RSI cross Up 30 mark Over Sold – 413.0
Stop loss – 406 – Last bottom.
feel free to call us +919500077790 info@eqsis.com
Relative Strength Index – RSI
Use 21 days Chart.
Sell when RSI cross down 70 mark Over Bought – 448.9
Buy when RSI cross Up 30 mark Over Sold – 413.0
Stop loss – 406 – Last bottom.
| M | T | W | T | F | S | S |
|---|---|---|---|---|---|---|
| 1 | 2 | 3 | 4 | 5 | ||
| 6 | 7 | 8 | 9 | 10 | 11 | 12 |
| 13 | 14 | 15 | 16 | 17 | 18 | 19 |
| 20 | 21 | 22 | 23 | 24 | 25 | 26 |
| 27 | 28 | 29 | 30 | 31 | ||
 Bearish-GAP-SHORT-BICON-25-10-2019 October 25, 2019
 FEDERAL BANK – BEARISH ENGULFING October 17, 2019
 Cummins India – Bearish Engulfing – 24Sep19 September 25, 2019
 Day29-Tata Motors DVR – Bearish Piercing – 12Sep19 September 12, 2019
 Day27-Bearish-Engulfing pattern-Tech Mahindtra-09Sep19 September 10, 2019
Stock Trading is business, the success depends not just on capital or subscribing advisory services or participating workshops. The factors such as your awareness level about business, Efforts and your contributions, Smartness, Knowledge in analysis and trading instrument, availability of infrastructure and emotional control determine your success.
EQSIS, A Stock Market Research Firm
Knowledge is Power. Here you may start from basics, get support while practicing and evolve as active analyst, later you can become a pro


Hi,
Use the RSI indicator which is available in this portal.
Company Name: VIPIND
Direction: Bullish Above
Entry Price: 414
Stop Loss: 406.6
Target Price: 448.9
Duration: 1 Week
Hi Naresh,
Kindly Ignore company Details. I have updated comment below
Company Name: AMBUJACEM
Direction: Bullish Above
Entry Price: 30
Stop Loss: 17
Target Price: 70
Duration: 6 Months
Hi,
It’s really perfect!