
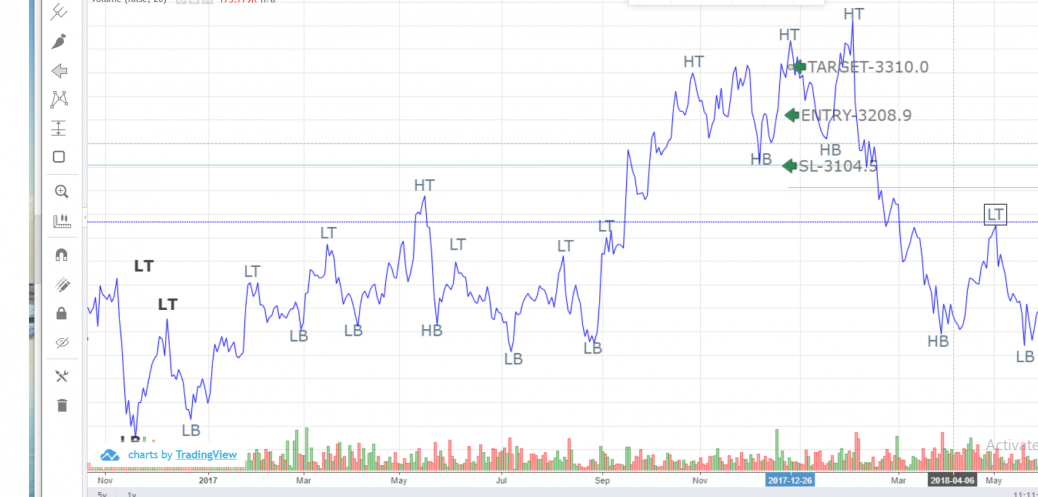
As per Dow theory in stock bajaj taking daily chart of previous 2 years with HB-HT to buy demand zone.LT-LB to sell supply zone. marked in the chart below.
feel free to call us +919500077790 info@eqsis.com
As per Dow theory in stock bajaj taking daily chart of previous 2 years with HB-HT to buy demand zone.LT-LB to sell supply zone. marked in the chart below.
| M | T | W | T | F | S | S |
|---|---|---|---|---|---|---|
| 1 | 2 | 3 | 4 | 5 | ||
| 6 | 7 | 8 | 9 | 10 | 11 | 12 |
| 13 | 14 | 15 | 16 | 17 | 18 | 19 |
| 20 | 21 | 22 | 23 | 24 | 25 | 26 |
| 27 | 28 | 29 | 30 | 31 | ||
 Bearish-GAP-SHORT-BICON-25-10-2019 October 25, 2019
 FEDERAL BANK – BEARISH ENGULFING October 17, 2019
 Cummins India – Bearish Engulfing – 24Sep19 September 25, 2019
 Day29-Tata Motors DVR – Bearish Piercing – 12Sep19 September 12, 2019
 Day27-Bearish-Engulfing pattern-Tech Mahindtra-09Sep19 September 10, 2019
Stock Trading is business, the success depends not just on capital or subscribing advisory services or participating workshops. The factors such as your awareness level about business, Efforts and your contributions, Smartness, Knowledge in analysis and trading instrument, availability of infrastructure and emotional control determine your success.
EQSIS, A Stock Market Research Firm
Knowledge is Power. Here you may start from basics, get support while practicing and evolve as active analyst, later you can become a pro


In your chart you have marked LT and LB wrongly(see 3rd and 4th markings and again 7th and 8th top markings from Left to Right). If the Top is Lower than the previous one then only it is called Lower Top and vice versa for Higher Top. Same applies for Bottoms also. Correct the markings. This is for your information.