
Refer comments section
feel free to call us +919500077790 info@eqsis.com
Refer comments section
| M | T | W | T | F | S | S |
|---|---|---|---|---|---|---|
| 1 | 2 | 3 | 4 | 5 | 6 | 7 |
| 8 | 9 | 10 | 11 | 12 | 13 | 14 |
| 15 | 16 | 17 | 18 | 19 | 20 | 21 |
| 22 | 23 | 24 | 25 | 26 | 27 | 28 |
| 29 | 30 | |||||
 Bearish-GAP-SHORT-BICON-25-10-2019 October 25, 2019
 FEDERAL BANK – BEARISH ENGULFING October 17, 2019
 Cummins India – Bearish Engulfing – 24Sep19 September 25, 2019
 Day29-Tata Motors DVR – Bearish Piercing – 12Sep19 September 12, 2019
 Day27-Bearish-Engulfing pattern-Tech Mahindtra-09Sep19 September 10, 2019
Stock Trading is business, the success depends not just on capital or subscribing advisory services or participating workshops. The factors such as your awareness level about business, Efforts and your contributions, Smartness, Knowledge in analysis and trading instrument, availability of infrastructure and emotional control determine your success.
EQSIS, A Stock Market Research Firm
Knowledge is Power. Here you may start from basics, get support while practicing and evolve as active analyst, later you can become a pro


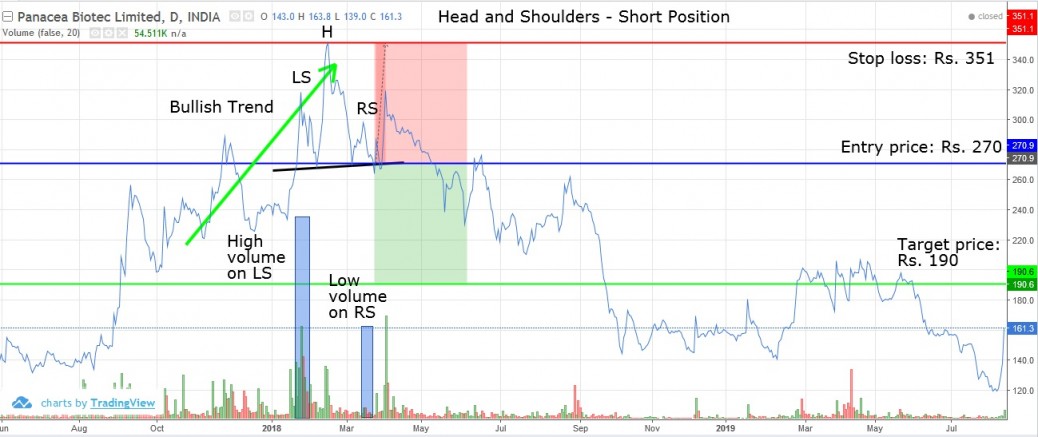
Trade plan:
• Significant bullish rally prior to Head and Shoulder pattern formation (indicating trend reversal)
• Shoulder-head-shoulder pattern can be seen in the graph (where head is significantly higher than shoulders)
• The pattern is formed across a period of 48 days (Shoulder-Head-Shoulder)
• The volume at Left shoulder is high indicating trend reversal from bullish to bearish i.e a stronger hand is liquidating the shares
• Volume is low at Right shoulder indicating the stronger hand has sold the shares and moved out of the market
• Short position created as the price goes below the Neckline at Rs 270.
• Risk to Reward ratio is 1:1
• Hence the Stop Loss created at tip of the Head at Rs. 351 and the Target price is Rs. 190.
Company Name: Panacea Biotec
Direction: Expected direction is Bearish Trend
Entry price: Rs. 270
Stop loss: Rs. 351
Target price: Rs. 190
Duration: Long term