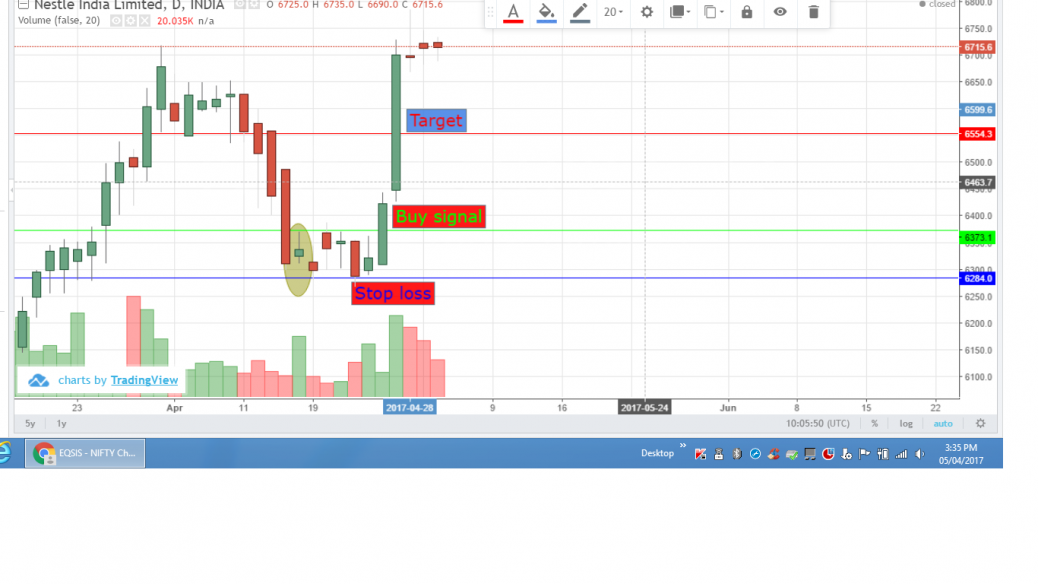
An inverted hammer pattern was formed in Nestle India LTD and it is seen around third week of April around 18th and a buy signal was seen on 26th April at price 6337 with stop loss of 6284 and likely target twice that of stop loss at 6555 within a day or two.
Nestle India LTD Inverted Bullish Hammer
feel free to call us +919500077790 info@eqsis.com
Stock Analysis
M | T | W | T | F | S | S |
---|---|---|---|---|---|---|
1 | 2 | 3 | 4 | 5 | 6 | 7 |
8 | 9 | 10 | 11 | 12 | 13 | 14 |
15 | 16 | 17 | 18 | 19 | 20 | 21 |
22 | 23 | 24 | 25 | 26 | 27 | 28 |
29 | 30 |
Bullish View
Bearish View
- Bearish-GAP-SHORT-BICON-25-10-2019 October 25, 2019
- FEDERAL BANK – BEARISH ENGULFING October 17, 2019
- Cummins India – Bearish Engulfing – 24Sep19 September 25, 2019
- Day29-Tata Motors DVR – Bearish Piercing – 12Sep19 September 12, 2019
- Day27-Bearish-Engulfing pattern-Tech Mahindtra-09Sep19 September 10, 2019
How this forum help stock traders?
Stock Trading is business, the success depends not just on capital or subscribing advisory services or participating workshops. The factors such as your awareness level about business, Efforts and your contributions, Smartness, Knowledge in analysis and trading instrument, availability of infrastructure and emotional control determine your success.
Hammer should have lengthy lower tail to confirm the bulls reclamation.
I thought it was an inverted hammer, since after a bearish trend having an inverted hammer as trend reversal and small consolidation phase with bullish uptrend. The point you have made has been noted and will be corrected in my next charting of hammer. Thanks so much.