
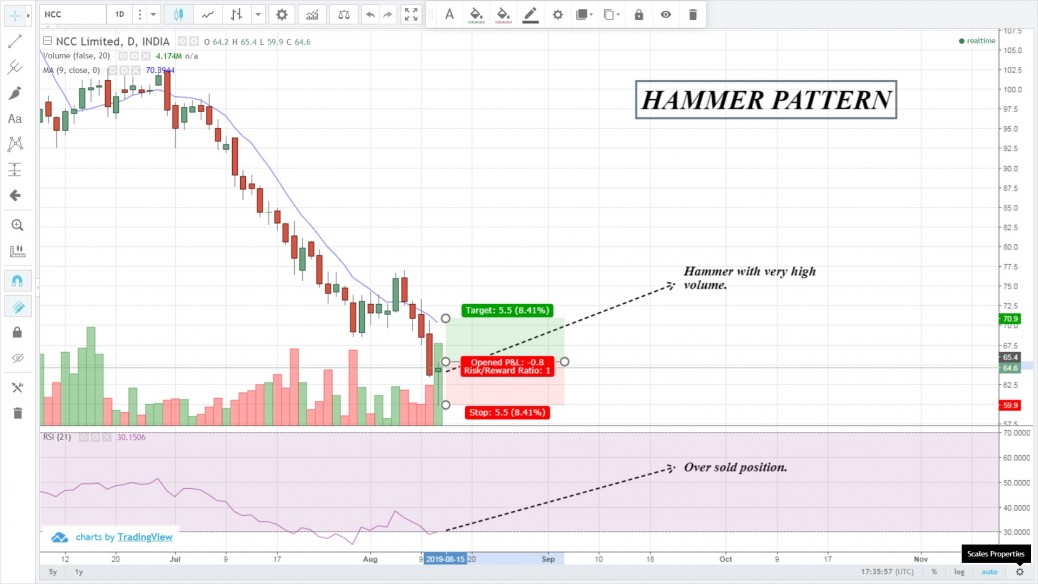
Following a series of negative candle during a downtrend, a positive candle with smaller body, smaller top tail and longer bottom tail representing hammer shape has appeared. During the Hammer candle the volume is also high. This shows trend reversal. So we can take long position only if the price moves above the top tail of the hammer candle.
* When we look at the Relative Strength index it indicates oversold position.
*It has shown good recovery in intraday chart.
—————————————————————————————–
Stock Ticker – NSE: NCC – NCC Ltd. – CONSTRUCTION
Bullish Trade plan:
Entry Level 65.40 Target 70.90 Stoploss 59.90
Analyst Rating – :4/5
View Posted on 2019-08-14


Hi , is this captured on 14th Aug 2019?
Yes. It was captured on 14th August.
ok thanks
Hi Ganesh, but the trade plan was not initiated, as the price continued to fall further.
yea true