
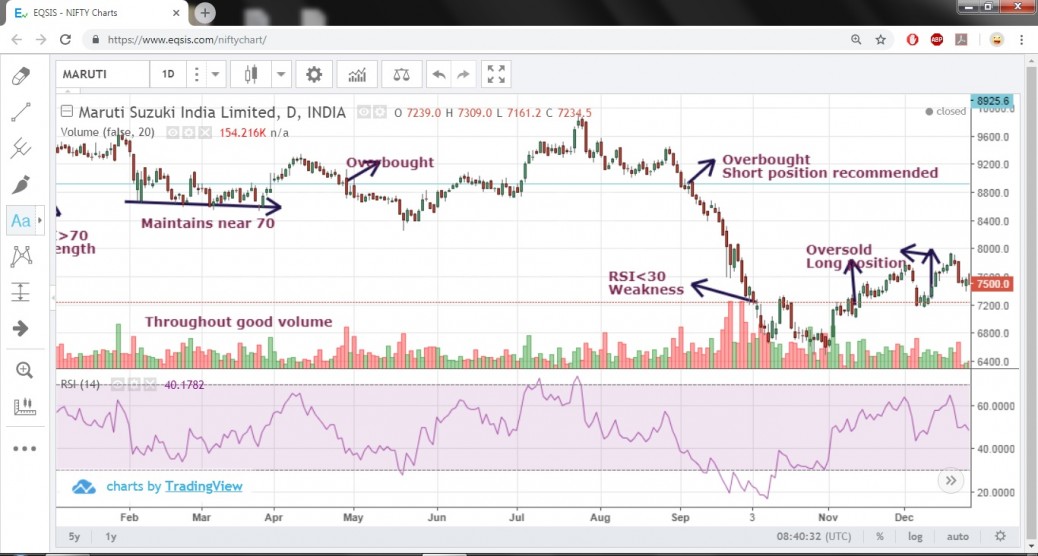
RSI is Relative Strength Index. Two parallel straight line drawn on near top and bottom waves of the non-trending chart. One way to interpret the RSI is by viewing the price as “overbought” – and due for a correction – when the indicator is above 70, and viewing the price as oversold – and due for a bounce – when the indicator is below 30. In a strong uptrend, the price will often reach 70 and beyond for sustained periods, and downtrends can stay at 30 or below for a long time.


Hi,
Good attempt ma’am. Read the following content which will help you to learn about RSI concept.
The RSI is well known as a momentum oscillator that measures the movements of the stock over a time period. The RSI is displayed as line graph that oscillates within a scale of 0 and 100. The major thing to watch out for are 30 and 70 reading in the scale which is widely known as the overbought or oversold level. The default parameter setting for the RSI is 14, that means it tracks the last 14 periods on a chart.
Overbought and Oversold
One of the best ways to use the RSI is by determining whether the stock is overbought or oversold. This method is an easy way to identify buying and selling opportunities in non-trending markets. However, understanding the logic of overbought/oversold can help you better to master this technique.
Bullish Signal
When the RSI falls below 30 it simply indicates the weakness of the stock but do not indicate an oversold scenario. When the stock rises back above the 30 level after a plunge then the stock is considered to be oversold and might be due for the bullish rally.
Bearish Signal
When the RSI rises above 70 it simply indicates the strength of the stock but do not indicate an overbought scenario. When the stock fell below the 70 level after a rise then the stock is considered to be overbought and might be due for the bearish rally.
Thank You for a detailed feedback. I will apply this technique for the charts in future. Once again Thank You for your concern.