
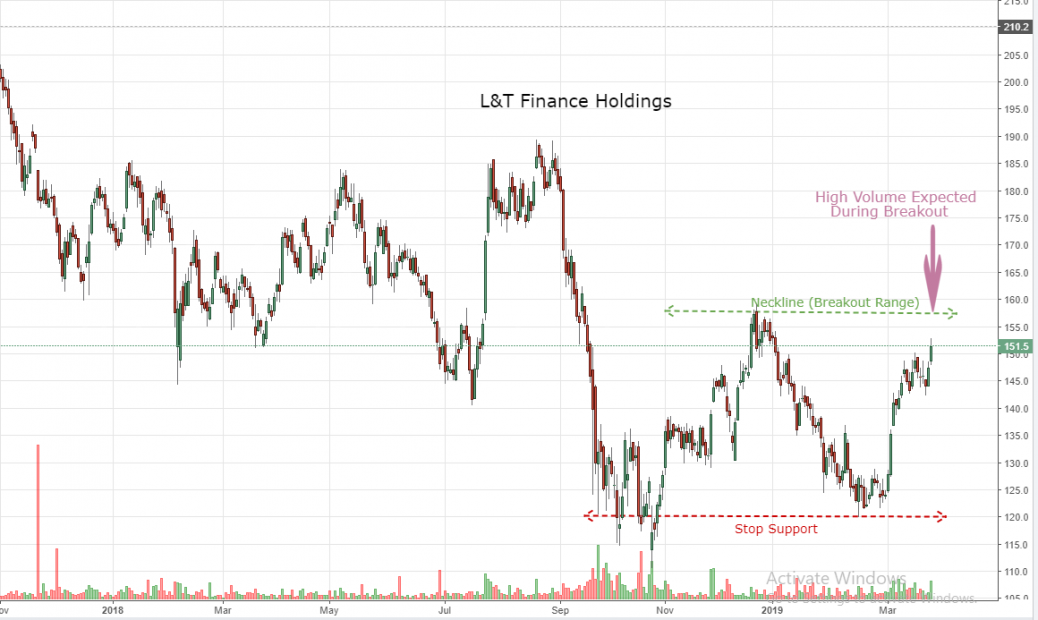
- L&TFH is bottomed out to have a double bottom pattern on its daily chart and currently trading near the neckline.
- The stock has witnessed a lower top and lower bottom formation for the past few months and currently taken a strong support at 110 level.
- The major resistance for the stock is placed at 160 level.
- On the indicator front, the stock is well placed above its 21-days moving average.
- A break past the neckline with high volume is expected to open the doors for further upside rally.


nice