
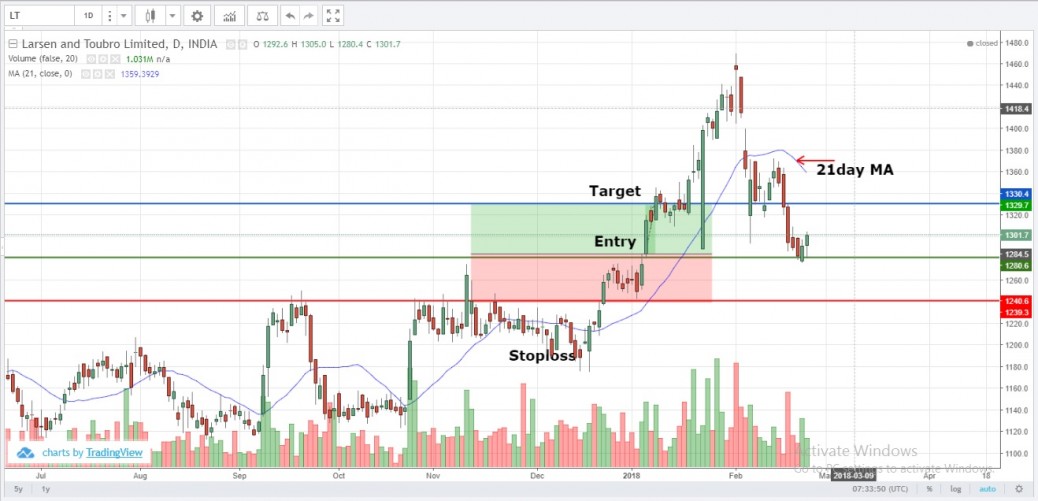
LT was trading in a prolonged sideways movement for 2-3 months around in the months of november and december 2017 and by the end of december 2017 a flag pattern was observed which was still within the range but the flag pattern indicates initiation of strong bullish trend. We can also notice the prices are moving above 21days moving average. Hence this gives us an opportunity to go long once the price is see to breakout from the sideways movement and with the assistance of moving average we can ensure the prices are in an uptrend and stay put in the trade until a reversal candle stick pattern is observed or if the prices break below the 21 day moving average. Here it is important to observe the moving average as only a supporting tool.


Hi sir,
your work is good.
Thanks vignesh 🙂