
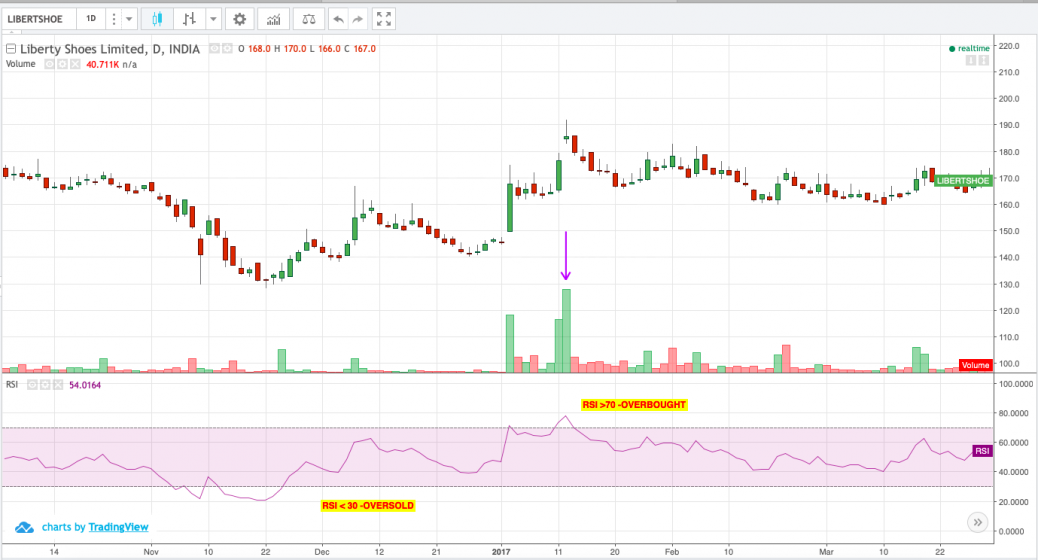
- RSI <30 indicates bullish trend & RSI>70 indicates bearish trend.
- RSI is indicator for non-trending zone.
- RSI indicates strength of the stock.
feel free to call us +919500077790 info@eqsis.com
| M | T | W | T | F | S | S |
|---|---|---|---|---|---|---|
| 1 | 2 | 3 | 4 | 5 | ||
| 6 | 7 | 8 | 9 | 10 | 11 | 12 |
| 13 | 14 | 15 | 16 | 17 | 18 | 19 |
| 20 | 21 | 22 | 23 | 24 | 25 | 26 |
| 27 | 28 | 29 | 30 | 31 | ||
 Bearish-GAP-SHORT-BICON-25-10-2019 October 25, 2019
 FEDERAL BANK – BEARISH ENGULFING October 17, 2019
 Cummins India – Bearish Engulfing – 24Sep19 September 25, 2019
 Day29-Tata Motors DVR – Bearish Piercing – 12Sep19 September 12, 2019
 Day27-Bearish-Engulfing pattern-Tech Mahindtra-09Sep19 September 10, 2019
Stock Trading is business, the success depends not just on capital or subscribing advisory services or participating workshops. The factors such as your awareness level about business, Efforts and your contributions, Smartness, Knowledge in analysis and trading instrument, availability of infrastructure and emotional control determine your success.
EQSIS, A Stock Market Research Firm
Knowledge is Power. Here you may start from basics, get support while practicing and evolve as active analyst, later you can become a pro


Hi,
The stock moved past the resistance with the appearance of a high volume breakout gap on 12th Jan 2017, Actually, breakout gaps are rarely filled and they usually signal a change in trend but in this scenario, you took a short position by considering RSI signal….. My question is who’s having the strong grip (bulls or bears) after a breakout day
Here RSI > 70 indicating bearish trend.so obviously bears gave strong grip.