
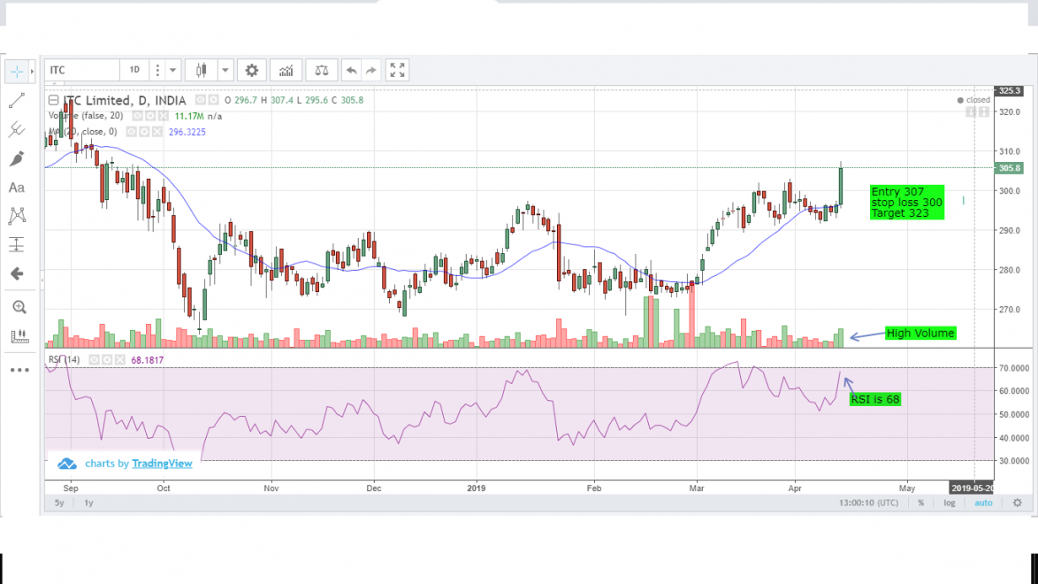
Bullish Candle stick pattern formation is seen in ITC stock which is trading above 20 and 5o SMA with High Volume also RSI level is at 68. Also it is trading above its previous resistance level.
feel free to call us +919500077790 info@eqsis.com
Bullish Candle stick pattern formation is seen in ITC stock which is trading above 20 and 5o SMA with High Volume also RSI level is at 68. Also it is trading above its previous resistance level.
| M | T | W | T | F | S | S |
|---|---|---|---|---|---|---|
| 1 | 2 | 3 | 4 | 5 | 6 | 7 |
| 8 | 9 | 10 | 11 | 12 | 13 | 14 |
| 15 | 16 | 17 | 18 | 19 | 20 | 21 |
| 22 | 23 | 24 | 25 | 26 | 27 | 28 |
| 29 | 30 | |||||
 Bearish-GAP-SHORT-BICON-25-10-2019 October 25, 2019
 FEDERAL BANK – BEARISH ENGULFING October 17, 2019
 Cummins India – Bearish Engulfing – 24Sep19 September 25, 2019
 Day29-Tata Motors DVR – Bearish Piercing – 12Sep19 September 12, 2019
 Day27-Bearish-Engulfing pattern-Tech Mahindtra-09Sep19 September 10, 2019
Stock Trading is business, the success depends not just on capital or subscribing advisory services or participating workshops. The factors such as your awareness level about business, Efforts and your contributions, Smartness, Knowledge in analysis and trading instrument, availability of infrastructure and emotional control determine your success.
EQSIS, A Stock Market Research Firm
Knowledge is Power. Here you may start from basics, get support while practicing and evolve as active analyst, later you can become a pro


Nice spot
Hello Mr Saravanan .This is Arthi here can you help me understand how did you arrive that it will reach the reach in the during as 15 days . Also you have mentioned ITC stock which is trading above 20 and 5o SMA, what does it says.. Please help me understand
15 days is just an prediction and forecast. Sometimes even it can hit an target price within a week.
The moving average is an indicator that “summarizes” past prices and is plotted as a line on your chart. it’s a lagging indicator but it doesn’t mean it’s useless because the moving average indicator can help you identify the direction of the trend ( Uptrend is bullish, downtrend is bearish and sideway trend is the price is moving sideways) and the strength of it.
Talking about SMA to calculate a basic 50-day moving average A 50-day moving average is calculated by taking the closing prices for the last 50 days of a stock and adding them together. The result from the addition is then divided by the number of periods, in this case, 50.
The example below shows a 5-day moving average evolving over three days.
Daily Closing Prices: 11,12,13,14,15,16,17
First day of 5-day SMA: (11 + 12 + 13 + 14 + 15) / 5 = 13
Second day of 5-day SMA: (12 + 13 + 14 + 15 + 16) / 5 = 14
Third day of 5-day SMA: (13 + 14 + 15 + 16 + 17) / 5 = 15
You can check this indicator in charts check for Moving Average, moving average exponential, Moving Average weighted. Please let me know if you need more information.