
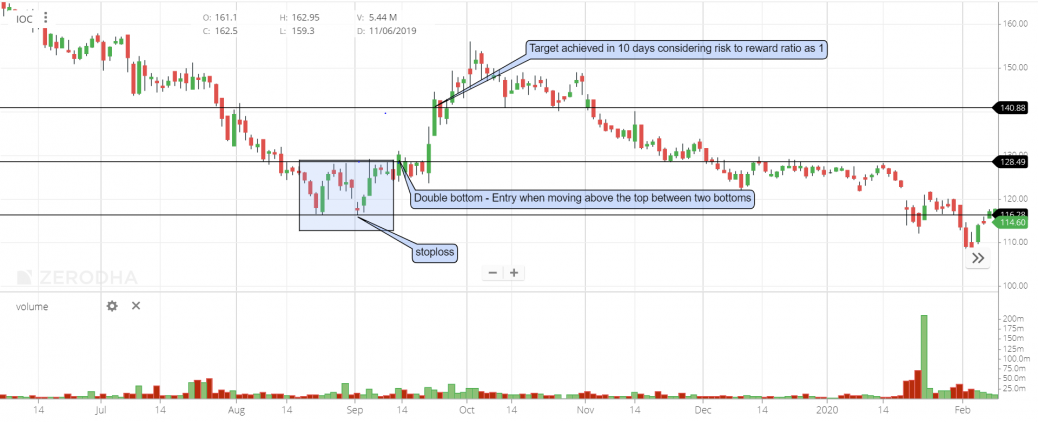
IOC has formed a double bottom pattern on Sep 2019, Volume was average. Interestingly a flag was formed after the double bottom confirming the bullish trend. Entry was at 128 when price moved above the top between the double bottom. stoploss was 116 low of double bottom. Considering risk to reward as 1, target 140 was achieved in 10 days.


Hi,
The duration between the two bottoms should be at least twenty plus candles. It may vary from a few weeks to many months but generally, it takes 1-3 months.