
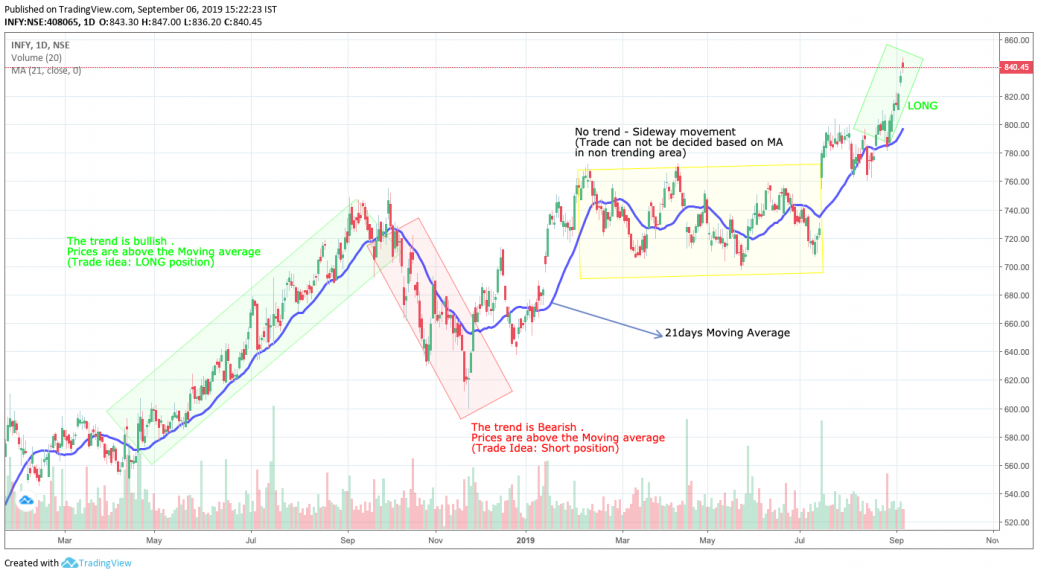
In the INFOSYS chart, 21 days moving average is applied. 21 days MA is selected because it can represent past 1 month MA. Higher days average (50,100 or 200 also can be taken according to the trading style)
The Moving average smoothens the data series (price chart) and makes it easier to spot trends.
MA is a trend following indicator. It works very well in trending markets.
MA is not suitable for Non-trending markets.
The prices above the MA line is considered as bullish and the trader may go LONG. When the price is below the MA it is for SHORT.


