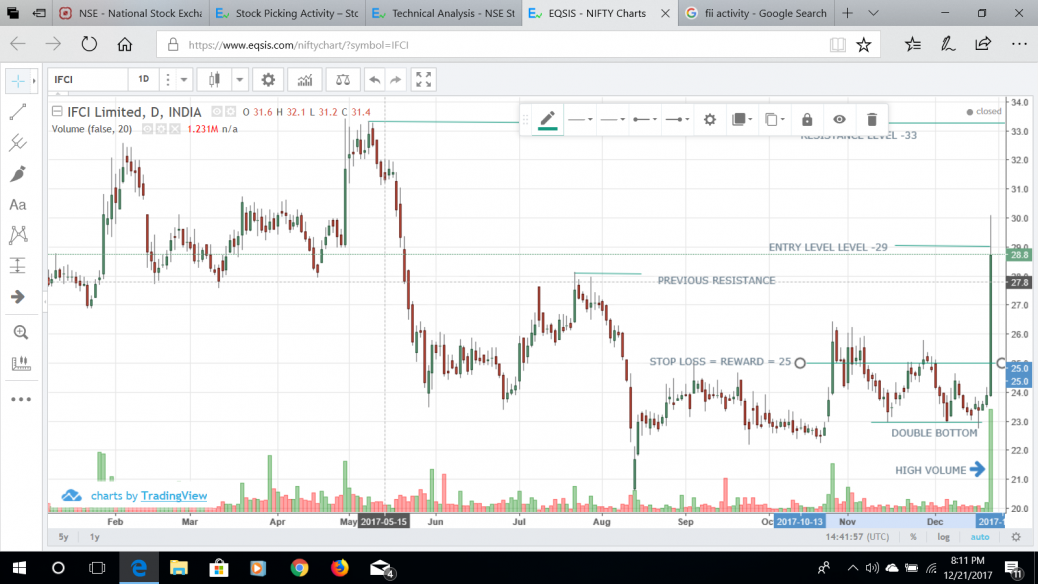
IFCI STOCK HAD GOOD VOLUME TODAY. DOUBLE BOTTOM IS SEEN BREAKING OUT. TODAY’S BREAKOUT HAS BREACHED PREVIOUS RESISTANCE ALSO. HENCE BULLISH VIEW IS CREATED HERE. LONG POSITION CREATED TARGETING PRICE AT NEXT RESISTANCE LEVEL. STOP LOSS IS NOT AT THE BOTTOM OF DOUBLE BOTTOM BUT FIXED EQUIVALENT TO THE REWARD EXPECTED.
IFCI – BULLISH- DOUBLE BOTTOM
feel free to call us +919500077790 info@eqsis.com
Stock Analysis
M | T | W | T | F | S | S |
---|---|---|---|---|---|---|
1 | 2 | 3 | 4 | 5 | 6 | 7 |
8 | 9 | 10 | 11 | 12 | 13 | 14 |
15 | 16 | 17 | 18 | 19 | 20 | 21 |
22 | 23 | 24 | 25 | 26 | 27 | 28 |
29 | 30 |
Bullish View
Bearish View
- Bearish-GAP-SHORT-BICON-25-10-2019 October 25, 2019
- FEDERAL BANK – BEARISH ENGULFING October 17, 2019
- Cummins India – Bearish Engulfing – 24Sep19 September 25, 2019
- Day29-Tata Motors DVR – Bearish Piercing – 12Sep19 September 12, 2019
- Day27-Bearish-Engulfing pattern-Tech Mahindtra-09Sep19 September 10, 2019
How this forum help stock traders?
Stock Trading is business, the success depends not just on capital or subscribing advisory services or participating workshops. The factors such as your awareness level about business, Efforts and your contributions, Smartness, Knowledge in analysis and trading instrument, availability of infrastructure and emotional control determine your success.
Hi sir,
Here double bottom pattern is not fully formed, it has not completed its pattern. so it may not be the double bottom.
Please see the attached chart. Double bottom has formed in about one month time from November to December. there is a neckline also. however in the second bottom while moving up again a bottom like situation has come. this may be due to presence of sellers. however the bulls have taken over a little later and there is clear breakout. There is good volume also here. if there are any suggestions you have to my comment please post the same to help me understand the concept better.