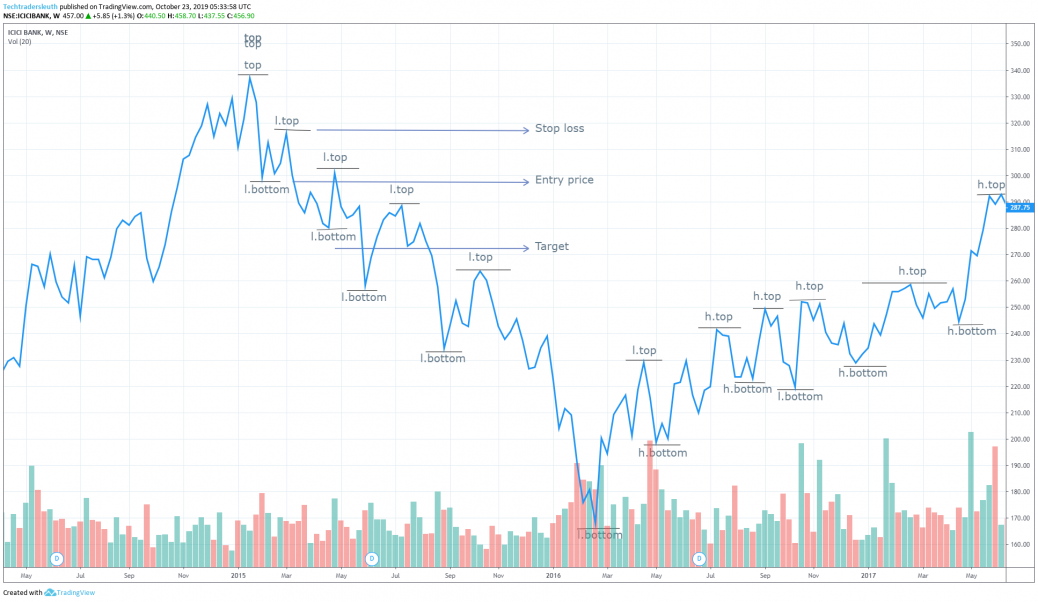
Witnessed lower top and lower bottom in ICICI Bank during 2015-2016,in many places. And there is indication of good volume, So safe to assume a bearish trend. So trade plan would be to take short position: with interval of 20:25, where 20 representing price difference betwen entry point and stop loss, and 25 represnting price difference between entry point and target. So ENTRY POINT=297.75, TARGET=272.25, STOP LOSS=317.35. Finally the profit margin is 5 rs. And the target has been achieved at may 2015.
ICICI-DOW’S-BEARISH TREND.
feel free to call us +919500077790 info@eqsis.com
Stock Analysis
M | T | W | T | F | S | S |
---|---|---|---|---|---|---|
1 | 2 | 3 | 4 | 5 | ||
6 | 7 | 8 | 9 | 10 | 11 | 12 |
13 | 14 | 15 | 16 | 17 | 18 | 19 |
20 | 21 | 22 | 23 | 24 | 25 | 26 |
27 | 28 | 29 | 30 | 31 |
Bullish View
Bearish View
- Bearish-GAP-SHORT-BICON-25-10-2019 October 25, 2019
- FEDERAL BANK – BEARISH ENGULFING October 17, 2019
- Cummins India – Bearish Engulfing – 24Sep19 September 25, 2019
- Day29-Tata Motors DVR – Bearish Piercing – 12Sep19 September 12, 2019
- Day27-Bearish-Engulfing pattern-Tech Mahindtra-09Sep19 September 10, 2019
How this forum help stock traders?
Stock Trading is business, the success depends not just on capital or subscribing advisory services or participating workshops. The factors such as your awareness level about business, Efforts and your contributions, Smartness, Knowledge in analysis and trading instrument, availability of infrastructure and emotional control determine your success.
Hi Sir,
It is a very nice analysis.
Thanks for posting.
Thanks!!!,
Hi,
Good spot… Hope you got a better understanding about dow concept