
Opinion please
feel free to call us +919500077790 info@eqsis.com
| M | T | W | T | F | S | S |
|---|---|---|---|---|---|---|
| 1 | 2 | 3 | 4 | 5 | ||
| 6 | 7 | 8 | 9 | 10 | 11 | 12 |
| 13 | 14 | 15 | 16 | 17 | 18 | 19 |
| 20 | 21 | 22 | 23 | 24 | 25 | 26 |
| 27 | 28 | 29 | 30 | 31 | ||
 Bearish-GAP-SHORT-BICON-25-10-2019 October 25, 2019
 FEDERAL BANK – BEARISH ENGULFING October 17, 2019
 Cummins India – Bearish Engulfing – 24Sep19 September 25, 2019
 Day29-Tata Motors DVR – Bearish Piercing – 12Sep19 September 12, 2019
 Day27-Bearish-Engulfing pattern-Tech Mahindtra-09Sep19 September 10, 2019
Stock Trading is business, the success depends not just on capital or subscribing advisory services or participating workshops. The factors such as your awareness level about business, Efforts and your contributions, Smartness, Knowledge in analysis and trading instrument, availability of infrastructure and emotional control determine your success.
EQSIS, A Stock Market Research Firm
Knowledge is Power. Here you may start from basics, get support while practicing and evolve as active analyst, later you can become a pro


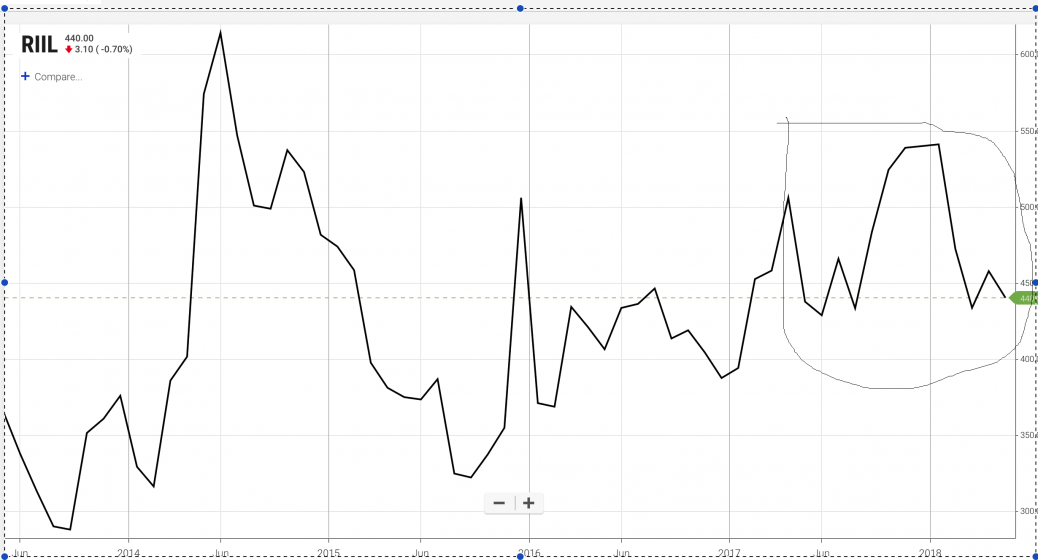
You are chosen monthly chart for analysis, then you should mention it in your analysis.
You have also not mentioned the labels, like left shoulder, head and right shoulder. You should mention the findings on the chart. You have not drawn the neck line . Head and shoulder is a bearish reversal pattern and one should look for shorting opportunity when stock breaks the neck line and not the buy the stock as mentioned by you. You have not mentioned any thing about the volume in your analysis. You should also mention about the stop- loss and target.
You should also mention about the possible duration expected to achieve the target.
I think ,this is your first attempt , you have identified the pattern correctly , but you should improve as you see more charts. All the best.