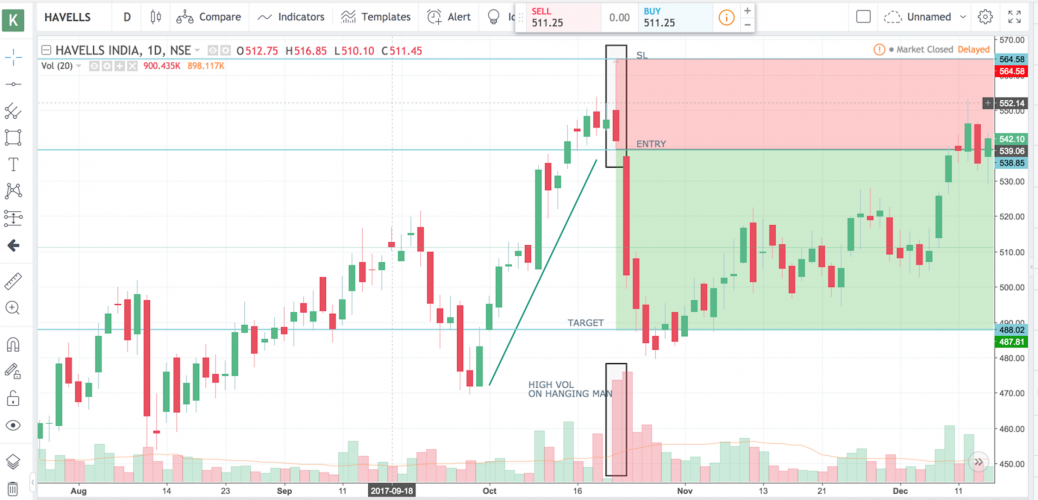
Havells witnessed a strong uptrend in price movement followed by red candle formation with upper tail size twice that of the candle body with a high volume trade concludes a hanging man price pattern formation. The formation can also looks like engulfing pattern followed by area gap.
Havells – Hanging Man
feel free to call us +919500077790 info@eqsis.com
Stock Analysis
M | T | W | T | F | S | S |
---|---|---|---|---|---|---|
1 | 2 | 3 | 4 | 5 | ||
6 | 7 | 8 | 9 | 10 | 11 | 12 |
13 | 14 | 15 | 16 | 17 | 18 | 19 |
20 | 21 | 22 | 23 | 24 | 25 | 26 |
27 | 28 | 29 | 30 | 31 |
Bullish View
Bearish View
- Bearish-GAP-SHORT-BICON-25-10-2019 October 25, 2019
- FEDERAL BANK – BEARISH ENGULFING October 17, 2019
- Cummins India – Bearish Engulfing – 24Sep19 September 25, 2019
- Day29-Tata Motors DVR – Bearish Piercing – 12Sep19 September 12, 2019
- Day27-Bearish-Engulfing pattern-Tech Mahindtra-09Sep19 September 10, 2019
How this forum help stock traders?
Stock Trading is business, the success depends not just on capital or subscribing advisory services or participating workshops. The factors such as your awareness level about business, Efforts and your contributions, Smartness, Knowledge in analysis and trading instrument, availability of infrastructure and emotional control determine your success.
Hi sir,
This is not hanging man pattern as it is not justifies the condition that upper tail should be 2 times the body with no or less lower tail.
My bad. I was under the assumption a inverted hammer is ‘Hanging Man’. Thanks for the comments Vignesh.
Ofcourse inverted hammer with red body is a hanging man. Here candlstick body is big so it doesn’t justify the hanging man pattern.
Got you. Thanks Vignesh!