
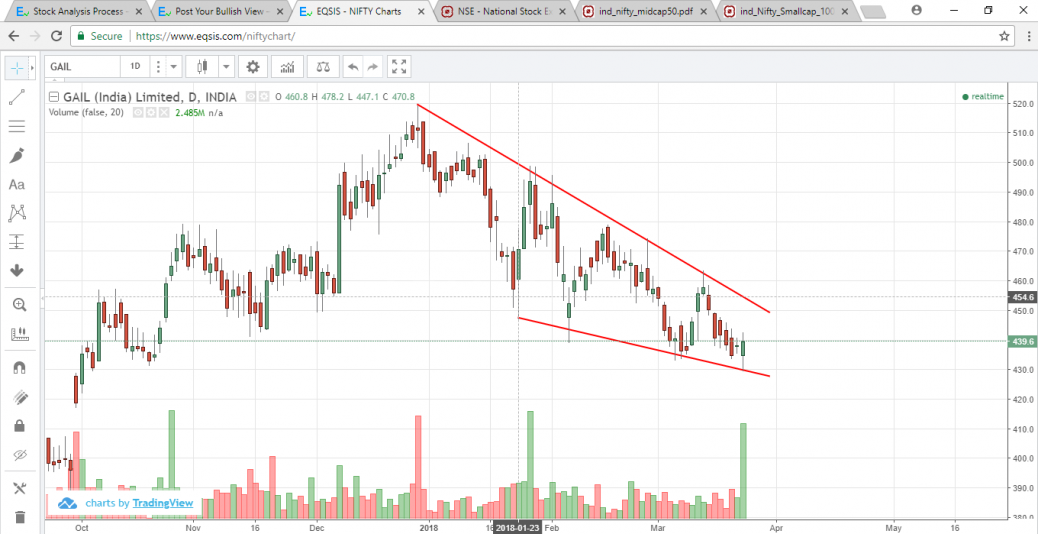
gail has form a lower low lower high formation and if we join the trend line with high and low stock has taken support of the trend line and we can except stock to go till upper trend line and stop loss will be below the down trend line
feel free to call us +919500077790 info@eqsis.com
gail has form a lower low lower high formation and if we join the trend line with high and low stock has taken support of the trend line and we can except stock to go till upper trend line and stop loss will be below the down trend line
| M | T | W | T | F | S | S |
|---|---|---|---|---|---|---|
| 1 | 2 | 3 | 4 | 5 | 6 | 7 |
| 8 | 9 | 10 | 11 | 12 | 13 | 14 |
| 15 | 16 | 17 | 18 | 19 | 20 | 21 |
| 22 | 23 | 24 | 25 | 26 | 27 | 28 |
| 29 | 30 | |||||
 Bearish-GAP-SHORT-BICON-25-10-2019 October 25, 2019
 FEDERAL BANK – BEARISH ENGULFING October 17, 2019
 Cummins India – Bearish Engulfing – 24Sep19 September 25, 2019
 Day29-Tata Motors DVR – Bearish Piercing – 12Sep19 September 12, 2019
 Day27-Bearish-Engulfing pattern-Tech Mahindtra-09Sep19 September 10, 2019
Stock Trading is business, the success depends not just on capital or subscribing advisory services or participating workshops. The factors such as your awareness level about business, Efforts and your contributions, Smartness, Knowledge in analysis and trading instrument, availability of infrastructure and emotional control determine your success.
EQSIS, A Stock Market Research Firm
Knowledge is Power. Here you may start from basics, get support while practicing and evolve as active analyst, later you can become a pro


Hi Sir,
I have slightly different opinion. Could you please suggest whether my interpretation is correct or not.
The doji which appears after a down trend is well supported by a bullish candle with huge volume indicating the reversal trend. The area between low and close of the bullish candle also provides good demand zone based on previous price levels.
Hence, my interpretation is as follows:
Entry price – 441.20 (i.e. above the high of Doji)
Stop loss – 429.40 (0.2 paisa less than low of the recent bullish candle)
Target – 458 ( close price of the previous top)
Regards,
Manoj
It can but it will face resistance at the trend line if it cross trend line in upward then the target can be even more 460 and 480 as they is high open interest at this point